Welcome to our first official publication of the Prometheus ETF Portfolio. The Prometheus ETF portfolio systematically combines our knowledge of macro & markets to create an active portfolio that aims to offer high risk-adjusted returns, durable performance, & low drawdowns. Given its systematic nature, we have tested the Prometheus ETF Portfolio through decades of history and have shown its durability. For those of you who are unacquainted with our systematic process, we offer a detailed explanation here:
In this publication, we will discuss the performance, positioning, & risks of the Prometheus ETF Portfolio— and it will be published every week on Fridays to help investors understand how our systematic process is navigating through markets. While we will generally share updates on the economic views driving our market views in this note, today, we will primarily focus on signals and new positions as we are in the process of wrapping up our latest Month In Macro, which will cover our views in detail. For those of you unfamiliar with our Month In Macro note, we suggest you get up to speed prior to the next release by reading our last note below:
Let us now turn to markets. Over the last week, we have observed commodities, treasuries, and gold all performing:
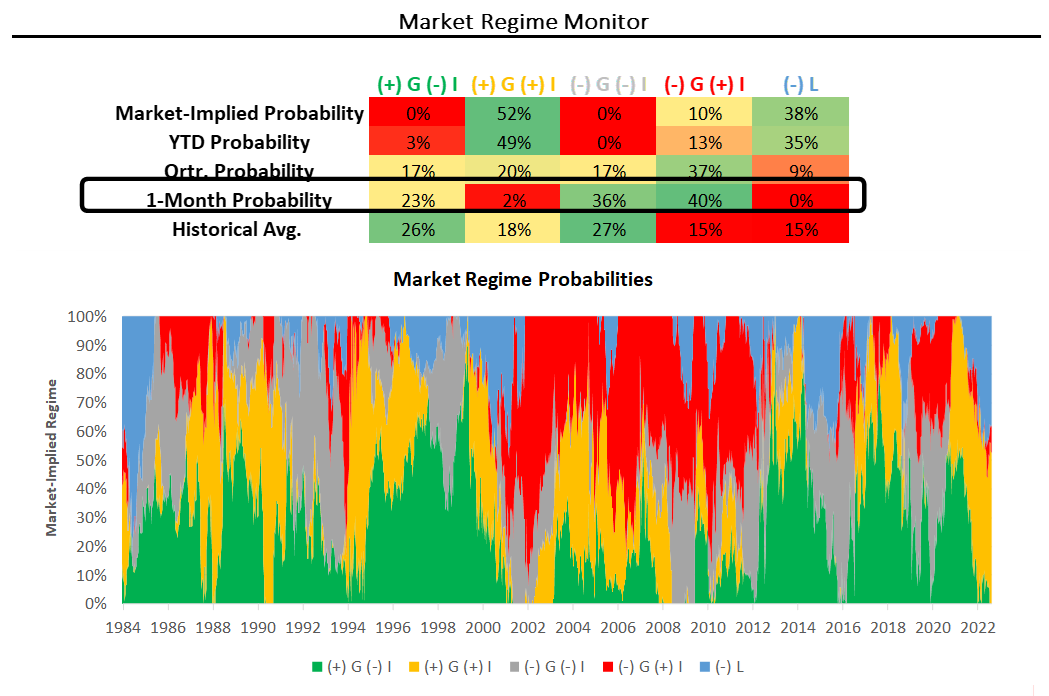
In terms of risk-adjusted returns, both gold and fixed-income securities have shown the best upside performance. In market regime terms, markets are increasingly in flux over the last month. However, there is an emerging trend in the form of increased pricing of falling economic growth. Below, we offer our market regime monitors, which tell us the market-implied odds of a given economic environment in the near future:
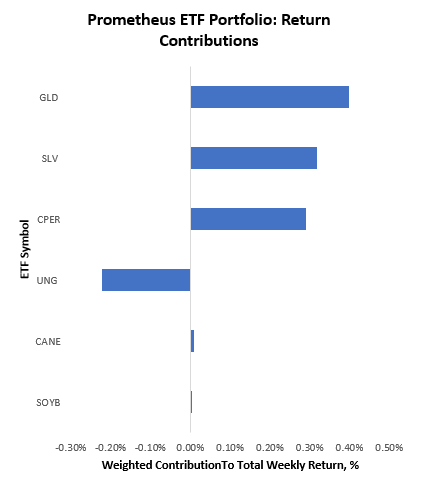
As evidenced by recent fixed income performance, the market-implied pricing of falling growth states, both inflationary and deflationary, has risen considerably, as highlighted above. However, our systems suggest that while these might be emergent conditions, the dominant regime remains one of stagflationary nominal growth with tightening liquidity, i.e. (+) G (+) I (-) L in the above. Within this context, our Prometheus ETF Portfolio has performed well this week, generating a return of 0.80% on an expected annualized volatility of 6%. Below, we show the weighted contributions of each of the positions to this return:
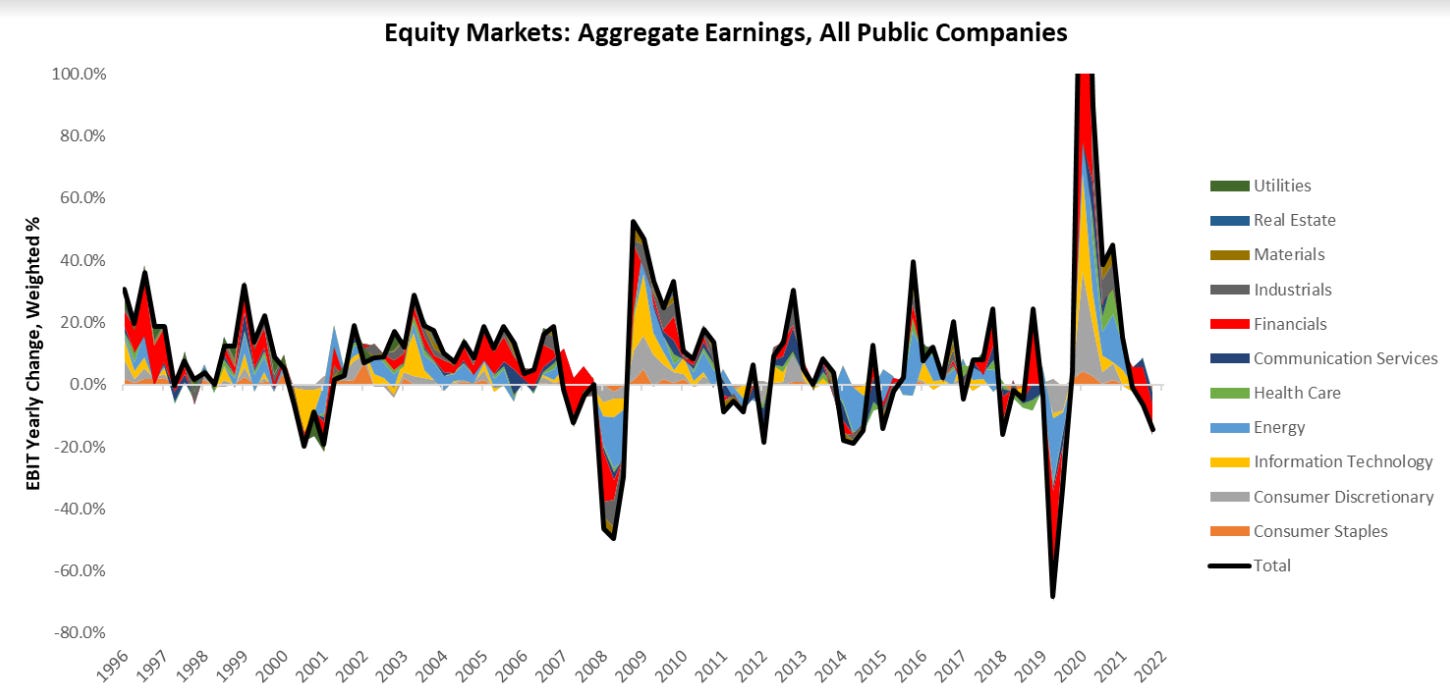
As we can see above, the majority of the positions were onside, with UNG showing the only real drag on the portfolio. This positioning was paired with a high cash holding. While this week is by no means a home run, we think that this return is healthy amidst the broader flux there is in markets today. Markets are beginning to price the probability of a shift from pricing predominantly based on the inflation & the Fed reaction function to one which is likely to be driven by marginal changes in economic growth. This shift is a subtle one and may well not continue; however, the initial conditions are being met both in terms of economic data (stabilizing inflation rates) and market regime pricing (disinflationary assets finding reprieve). We will discuss these dynamics in much greater detail in our coming Month In Macro. However, for the time being, we will say this— if inflation stabilizes over the next three months, the driving force in markets is likely to be the deterioration of profitability. In our tracking of economic conditions, we see that the first stages of this weakness have already begun. Below, we show our tracking of earnings for all publicly listed US companies:
In contrast with popular measures, our tracking shows that aggregate earnings are in contraction versus one year prior. This divergence is due to the fact that measures like the S&P 500 choose aggregate companies that possess the largest economies of scale relative to companies outside those aggregates. Currently, we are seeing financials, technology, and communications dragging on earnings. Conversely, we see energy, industrial, and utilities supporting aggregate earnings. Furthermore, our systems estimate that aggregate earnings are highly likely to worsen. In this environment, equities remain far more exposed to economic weakness and tightening liquidity than fixed-income securities.
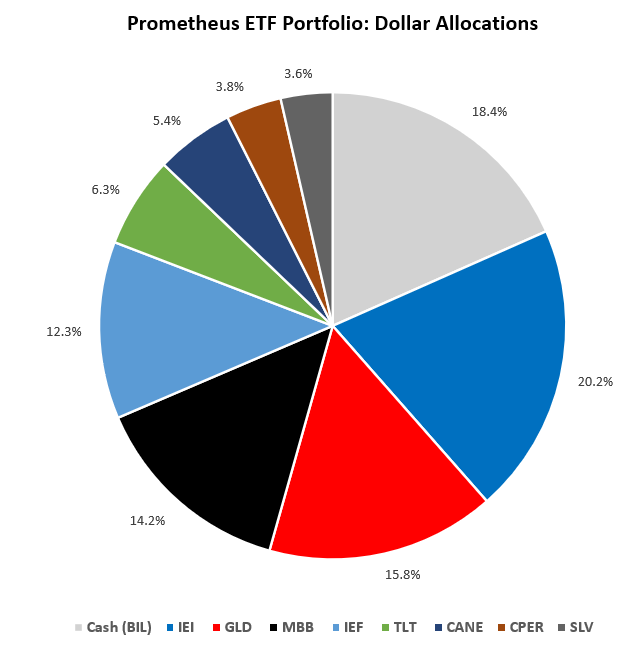
Consistent with these dynamics, our systems are now seeing nascent opportunities emerging across the Treasury curve amidst a slowing growth environment and have added exposure heading into next week:
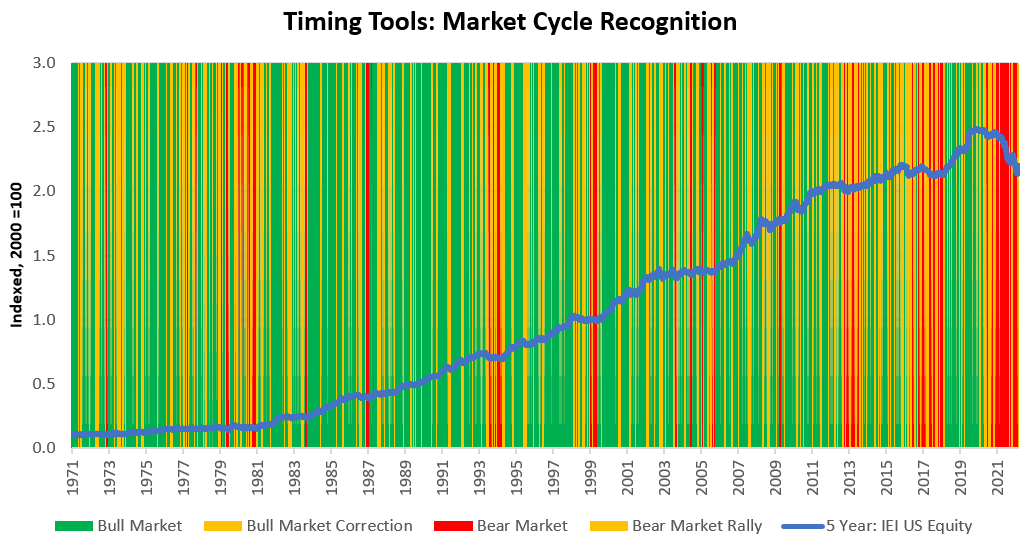
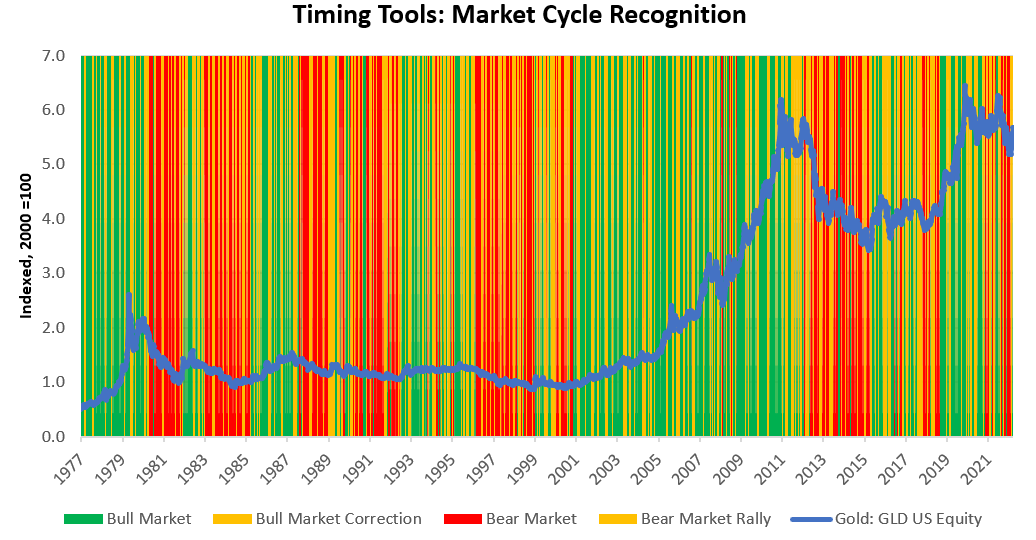
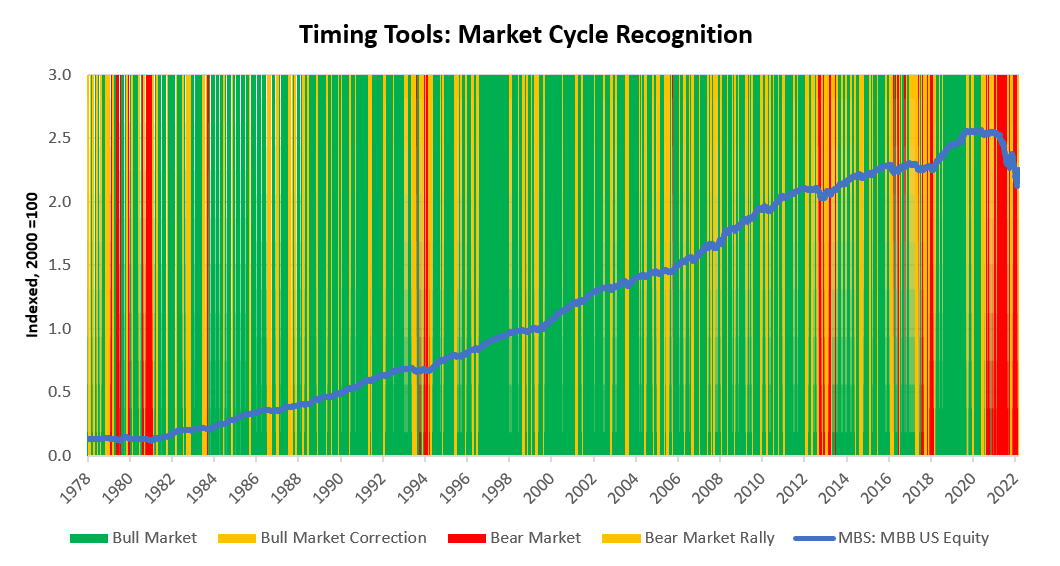
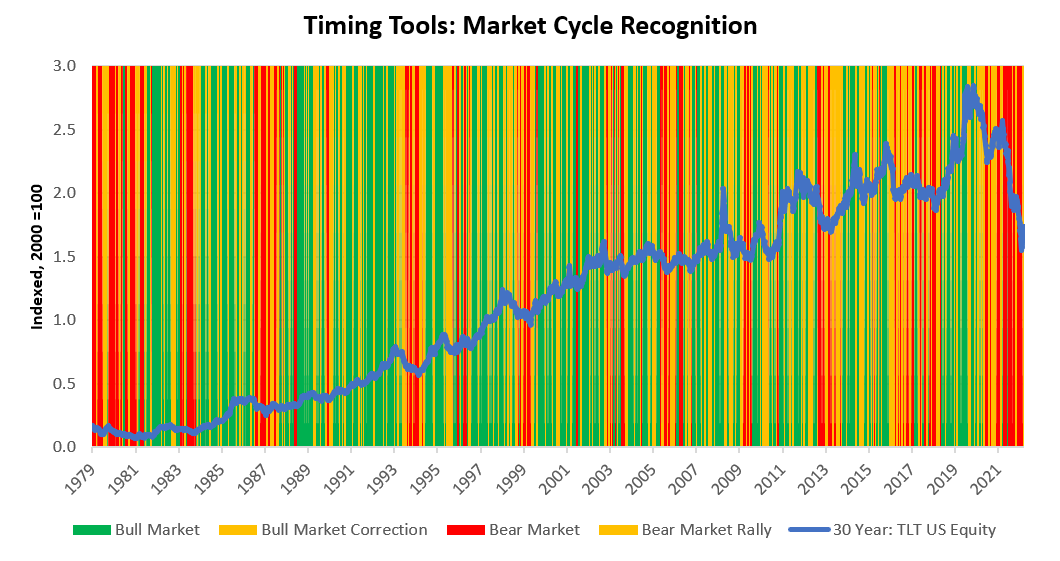
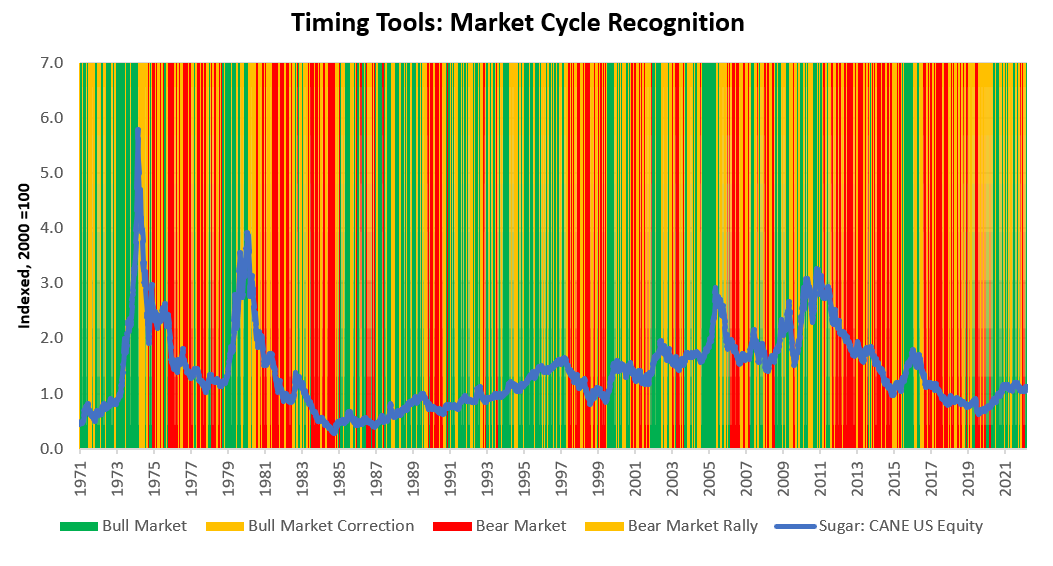
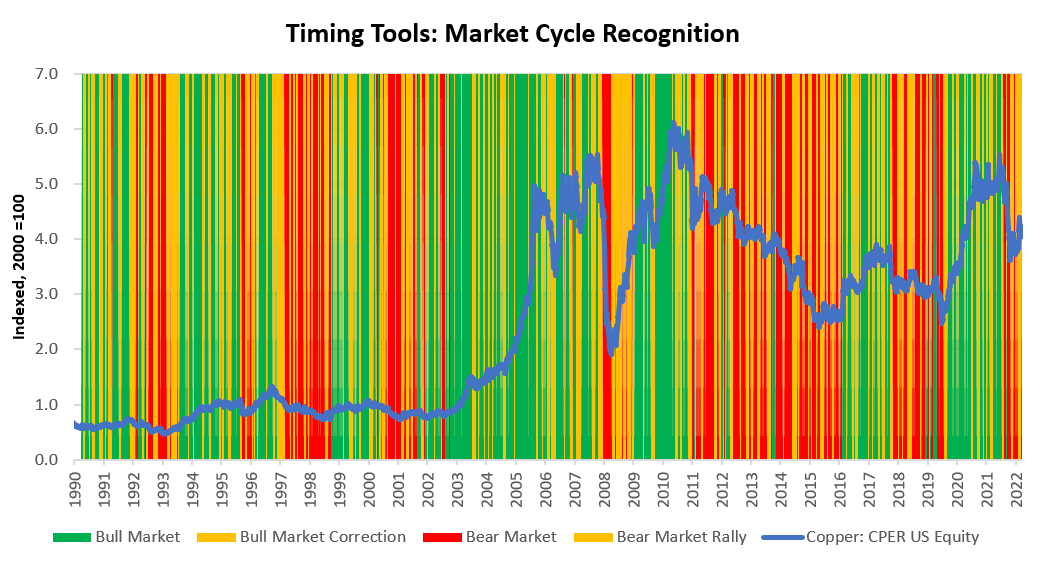
Additionally, the ETF Portfolio continues to hold allocations to metals and sugar. This portfolio has an expected volatility of 6.7%, with a maximum expected volatility of 10%. Given the diversification inherent in betting on commodities and fixed income, we see a moderate risk of achieving maximum volatility. For additional color, we share some of our market timing tools to help contextualize the positions within the broader economic context. A significant portion of our positions now represents potential transitions, with many assets turning from bear markets into bear market rallies.
IEI: Short Duration Treasuries remain in a Bear Market Rally. Bear market rallies can initiate regime change, and current market pricing suggests beta capture opportunities.
GLD: Gold remains in a Bull Market. Consistent with this, current market pricing suggests beta capture opportunities.
MBB: MBS remains in a Bear Market Rally. Bear market rallies can initiate regime change, and current market pricing suggests beta capture opportunities.
TLT: Treasury Bonds remain in a Bear Market Rally. Bear market rallies can initiate regime change, and current market pricing suggests beta capture opportunities.
CANE: Sugar remains in a Bull Market. Consistent with this, current market pricing suggests beta capture opportunities.
CPER: Copper has transitioned into a Bear Market from a Bear Market Rally.
SLV: Silver remains in a Bull Market. Consistent with this, current market pricing suggests beta capture opportunities.
Overall, while our estimate suggests that we remain in a stagflationary nominal growth market environment, changes look to be in motion. Our systematic positioning reflects these potential changes. It is early days in these positions, and economic data needs to change meaningfully for our systems to size up fixed-income exposures. We are beginning to see the early signs of a turning point in markets and the economy, which will take months to confirm. Our systems will cautiously guide us here. Until next week.
Disclaimer: No information provided here should be interpreted as investment advice. For further details, please reference the disclaimer in our Prometheus ETF Portfolio Primer linked above.



amazing stuff
Thanks for this. Three things
1. Please add a comparison of returns from the Prometheus ETF vs the SPY. Without a comparison to the market, we can't tell if the PETF is performing well.
2. Please change the color scheme used in the "Market Regime Monitor" graph. Green, yellow, and red are used for multiple meanings and consequently causes confusion when reading the graph. For example, green is used to represent the "increasing growth, decreasing inflation" regime as well as the percent chance of any regime's presence being >25%.
3. Please significantly reduce the timescale of the "Timing Tools: Market Cycle Recognition". (A) Looking at the returns of say IEI 50 years ago isn't useful to me and (B) the vertical market regime bands change too frequently in the 50-year timescale to be useful.