Welcome to our official publication of the Prometheus ETF Portfolio. The Prometheus ETF portfolio systematically combines our knowledge of macro & markets to create an active portfolio that aims to offer high risk-adjusted returns, durable performance, & low drawdowns. Given its systematic nature, we have tested the Prometheus ETF Portfolio through decades of history and have shown its durability. For those of you who are unacquainted with our systematic process, we offer a detailed explanation here:
In this publication, we will discuss the performance, positioning, & risks of the Prometheus ETF Portfolio— and it will be published every week on Fridays to help investors understand how our systematic process is navigating through markets. Before diving into our ETF Portfolio positions, we think it is important for subscribers to understand the context within which our systems choose their exposures. Below, we offer our detailed Month In Macro note, which contains the conceptual underpinnings of our systematic process within the context of the latest economic data:
After taking a break for the holiday season, our team will resume publishing Month In Macro for 2023, starting with the January edition. We look forward to sharing our developing insights on the economy— change is afoot. To offer some summary thoughts: we are beginning to see the initial phases of a turning point in business activity for business activity, inflation, and bonds.
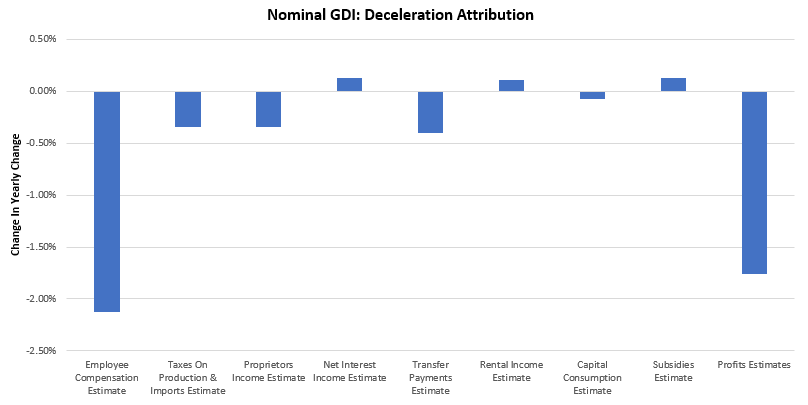
The labor market is currently the stronghold of the economy, with strong employment facilitating modest income growth, allowing overall activity to remain positive. Through our lenses, the key to understanding the future of employment is to understand how businesses are going to react in the current environment. Particularly, we are concerned with how a potential profit contraction will impact the labor market, which in turn will impact aggregate activity. Aggregate income is the sum of wages, profits, and taxes— and these competing interests vie for slices of total nominal income. It is important to recognize that businesses have a dual role in both paying wages and also attempting to maintain their profitability. In an environment where business profitability is threatened, businesses choose to reduce their costs, the most sizable of which is employment. In 2022, we witnessed a broad-based decline in overall activity in the economy. Below, we show our estimates of the attribution of the rate of change in GDI:
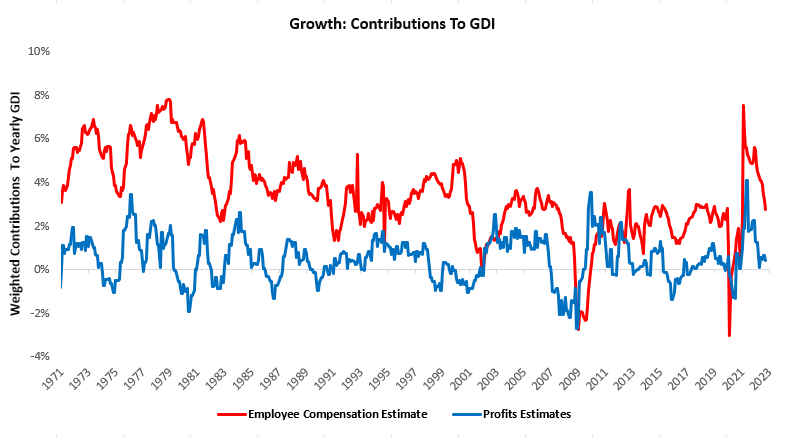
What is extremely important to note here is that while these decelerations were roughly commensurate with each component’s share of GDI, profits took on an outsized declaration relative to its typical GDI contribution. Profits typically account for about 7% of income growth, but in 2022 they took on approximately 40% of the total decline in incomes:
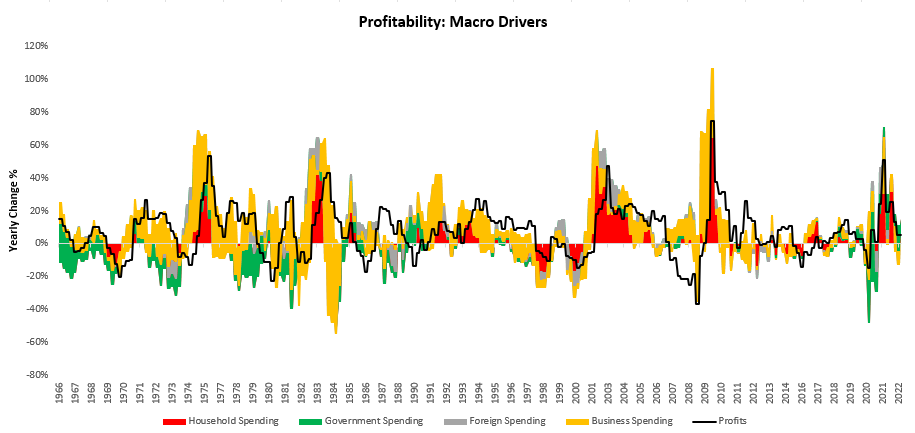
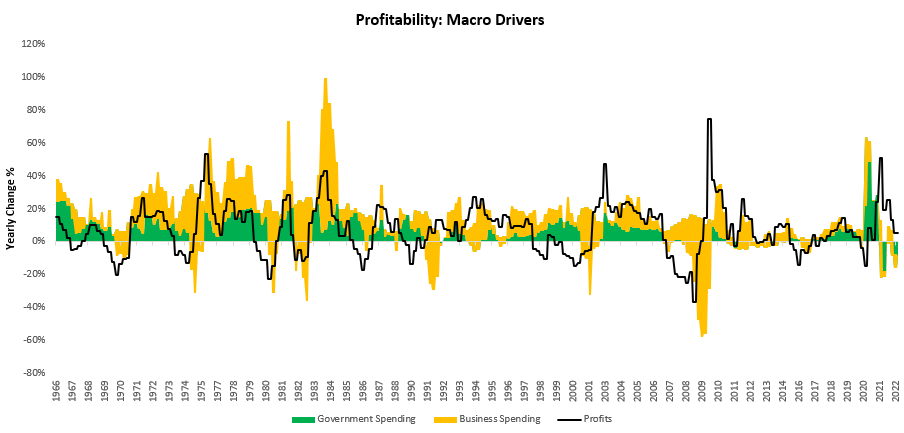
Looking at the macroeconomic drivers of this profit compression, we see two main drivers. The first is the government’s frugality in 2022 relative to prior years. The second is the weakness of business reinvestment. We show our attribution of profits by their major sources below:
We zoom in on these aforementioned areas:
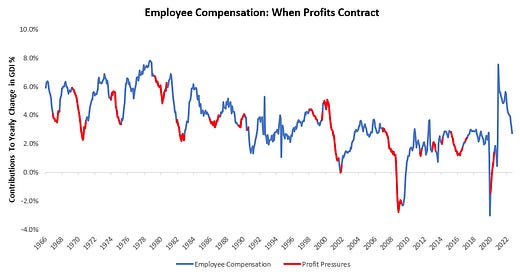
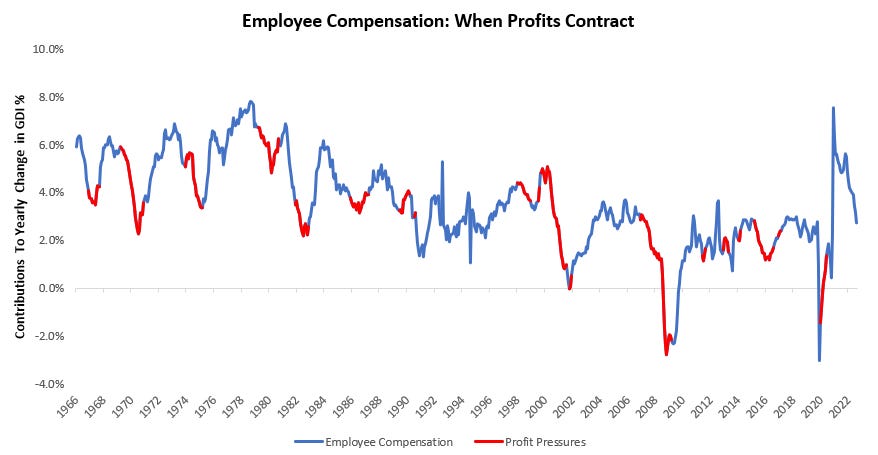
As profits decline, businesses typically resort to laying off employees in an attempt to claw back a larger/positive share of the nominal GDP pie. While this may make sense for an individual business, at the macroeconomic level, it creates a significant negative multiplier effect as it removes workers from the economy who are both recipients of income and sources of spending. It is important to note that this effect doesn’t need a contractionary labor market but just a marginally softer one. Below, we show how profit pressures usually manifest in the form of declining nominal employee compensation growth:
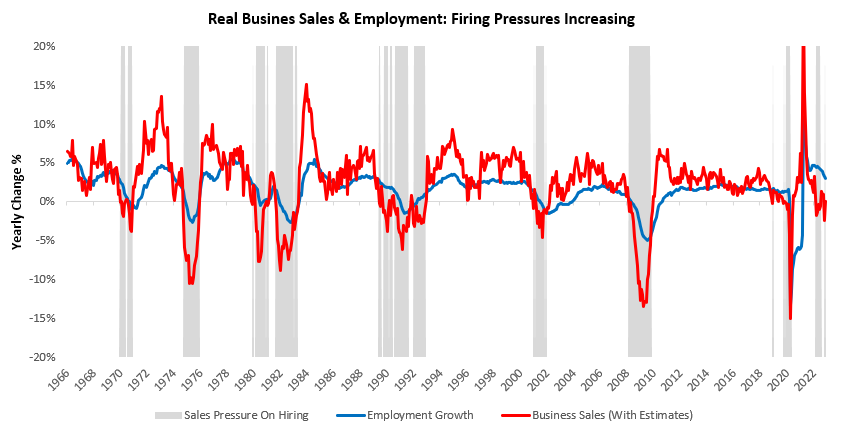
On average, yearly nominal employee compensation decelerates by 0.8% annualized once profits enter contraction. Coupled with a resilient level of inflation, the potential for a contraction in real spending is significant. We see these pressures on employment slowly mounting from a topline perspective as well:
Business sales create the need for employment. While nominal business sales likely determine nominal employee compensation, real business sales likely exert more influence on employment as a marginal driver to increase output. By our estimates, real sales have once again begun to contract, creating pressure on future hiring. These sales pressures on businesses tend to find their way into employment within about four months. However, given the extreme tightness of labor markets and sustained nominal activity, these dynamics could take significantly longer to play out— similar to the 1980s or 1990s in the above.
Consistent with the above pressures, our forward-looking estimates of real GDP suggest that we could see contractionary prints in year-over-year data beginning in Q2 of 2022, implying a potential contraction beginning in 2023. We will delve deeper into this topic and our profit outlook in our upcoming Month In Macro. What is important to realize is that while we have a degree of confidence in the trajectory of the economy based on our tracking of conditions, we need to avoid any false rigor in estimating the exact timing of future conditions. We navigate conditions as markets provide them to us. In that context, we think it is important to understand that the forces outlined above are indeed disinflationary amidst a high-inflation environment. We discussed this yesterday:
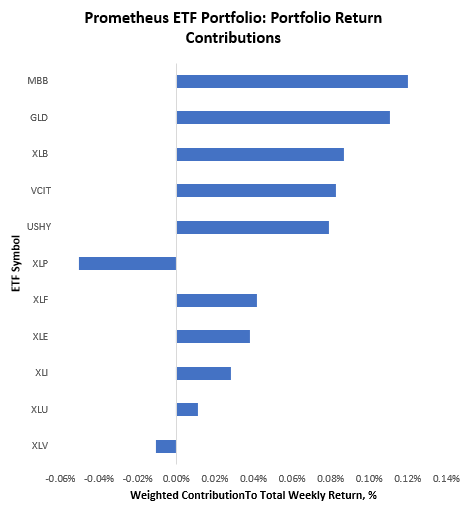
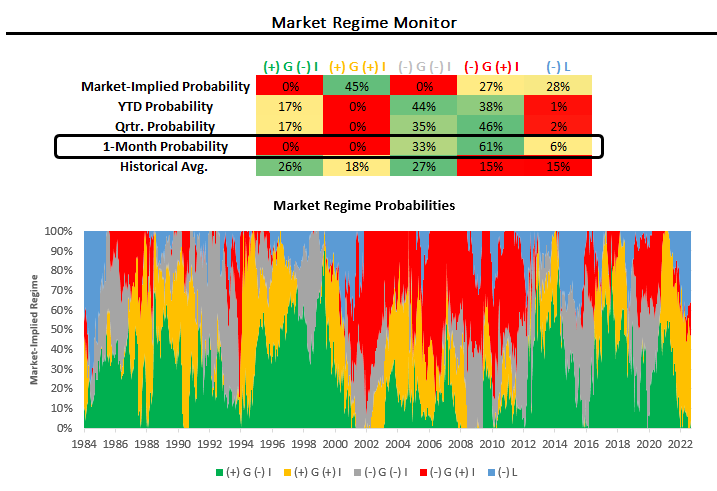
As a result of the competing forces in the economy, our expectation if for inflation to stabilize at an uncomfortably high rate while real growth is likely to be more volatile. This change will likely favor bonds over stocks and is unlikely to support commodities. Turning to our positions for this week, the Prometheus ETF Portfolio performed well in the context of betting on a disinflationary impulse in markets, up 90 basis points, with almost all positions performing well. We show the week-to-date attribution below:
Over the last month, markets have moved to price slowing growth, which has benefited a mix of assets tilted towards disinflation, i.e., a traditional 60/40 portfolio.
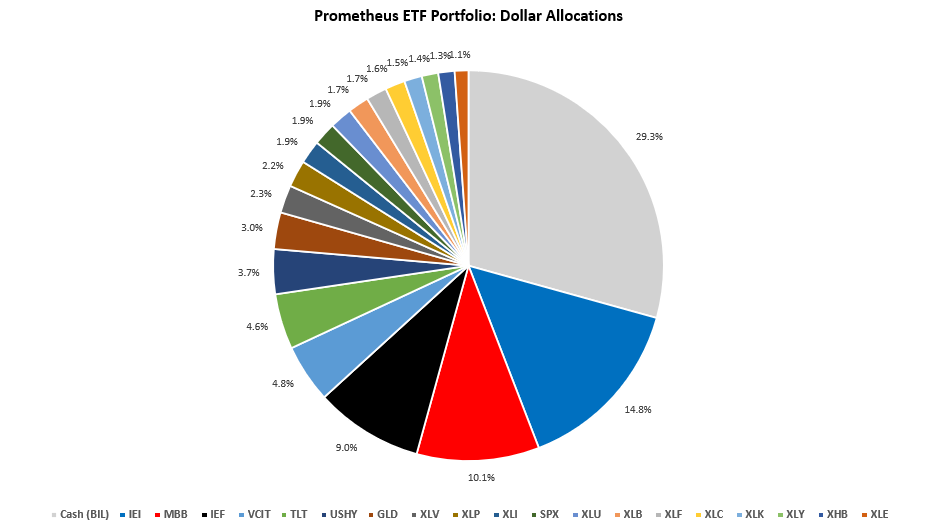
While we deem this period to likely be a transitory one, we swim with the tide, not against it. Turning to next week, our systems are looking to position the Prometheus ETF Portfolio as follows:
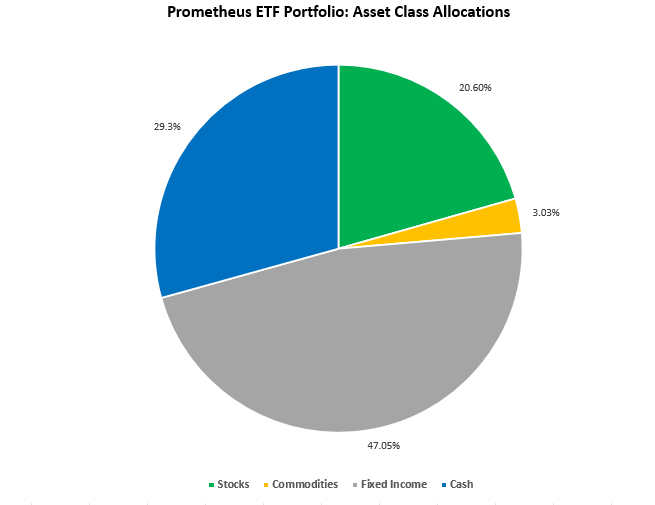
This allocation has an expected volatility of 7.6%, with maximum expected volatility of 10%. The major risk to this portfolio is a market shock coming from a change in the Fed’s expected reaction function, i.e., if nominal growth data is extremely strong, Fed tightening could be repriced. However, looking at the data calendar, this risk looks fairly muted next week— suggesting a modest risk of achieving maximum volatility. There are many positions above, but they can be condensed into the following asset class exposure:
For further context, we provide some commentary on select assets below:
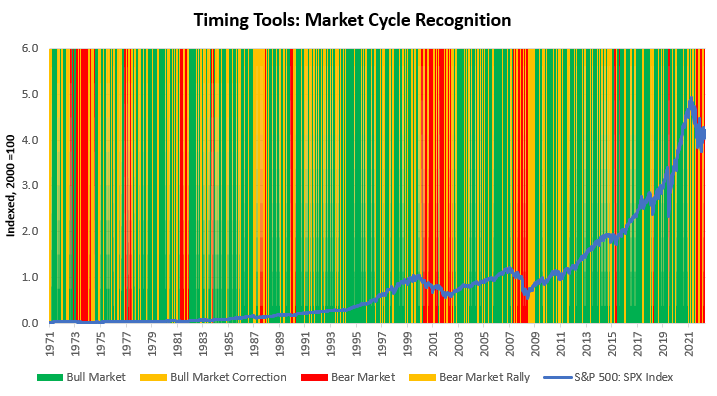
SPY: S&P 500 remains in a Bear Market Rally. Bear market rallies can initiate regime change, and current market pricing suggests beta capture opportunities.
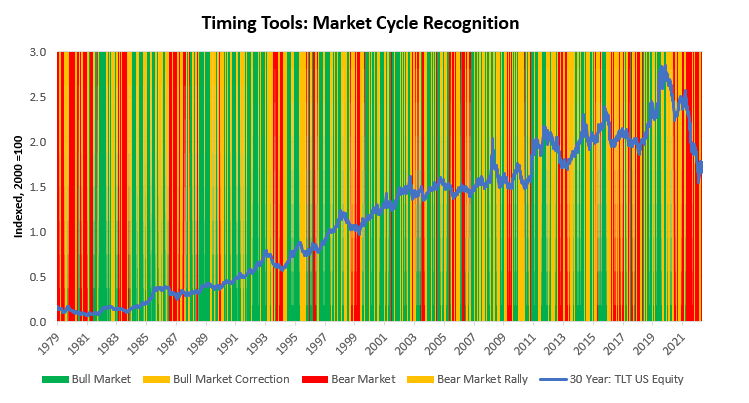
TLT: 20-30 Year Treasury has transitioned into a Bear Market Rally from a Bear Market. Bear market rallies can initiate regime change, and current market pricing suggests beta capture opportunities.
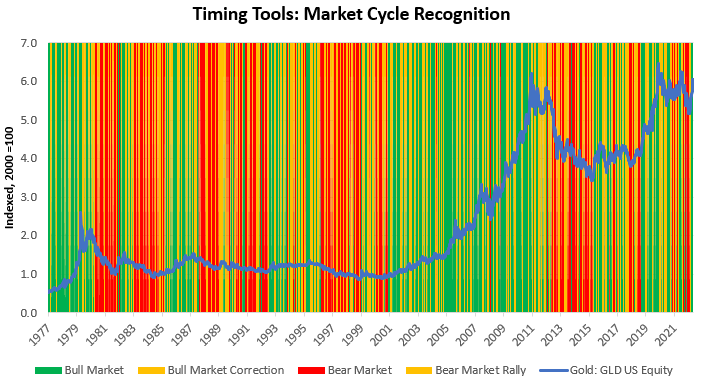
GLD: Gold remains in a Bull Market.
The economy and markets are showing signs of change consistent with the initial stages of a turning point. How long we remain in this environment remains uncertain. This is the hardest part of the cycle to navigate, and we will endeavor to navigate this successfully. Until next week.



Thanks for the update. Question about the market regime monitor: is the 1-month probability the probability of each regime over the next month? And what are the YTD and Qrtr probabilities representing? For Qrtr, for example, is it the probability of what regime we will have for the full Q1? Thanks
Is the BIL ETF essentially the same has holding the short term treasuries so that there is no down side risk? I looked the chart and it was confusing.