Welcome to our official publication of the Prometheus ETF Portfolio. The Prometheus ETF portfolio systematically combines our knowledge of macro & markets to create an active portfolio that aims to offer high risk-adjusted returns, durable performance, & low drawdowns. Given its systematic nature, we have tested the Prometheus ETF Portfolio through decades of history and have shown its durability. For those of you who are unacquainted with our systematic process, we offer a detailed explanation here:
In this publication, we will discuss the performance, positioning, & risks of the Prometheus ETF Portfolio— and it will be published every week on Fridays to help investors understand how our systematic process is navigating through markets. Before diving into our ETF Portfolio positions, we think it is important for subscribers to understand the context within which our systems choose their exposures. Below, we offer our detailed Month In Macro note, which contains the conceptual underpinnings of our systematic process within the context of the latest economic data:
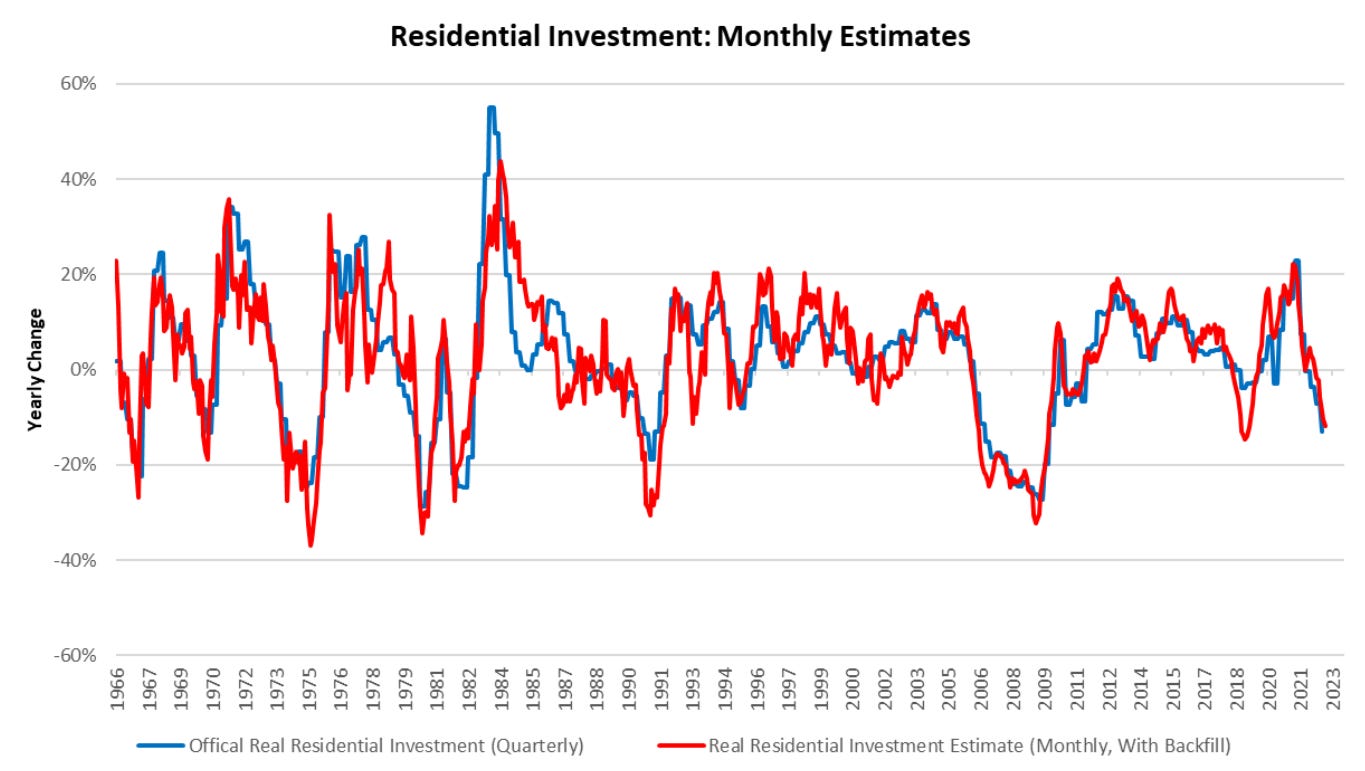
After taking a break for the holiday season, our team will resume publishing Month In Macro for 2023, starting with the January edition. We look forward to sharing our developing insights on the economy— change is afoot. To offer some summary thoughts: we are beginning to see the initial phases of a turning point in business activity for business activity, inflation, and bonds. We won’t get too into the weeds right now, but the crux of our observations is that conditions are falling in place for growth to continue on its downward trajectory into contraction that could be self-reinforcing. This week, we received a slew of data, marginally taking us towards these conditions. We received the latest construction data, which continues to point towards a slowdown in activity:
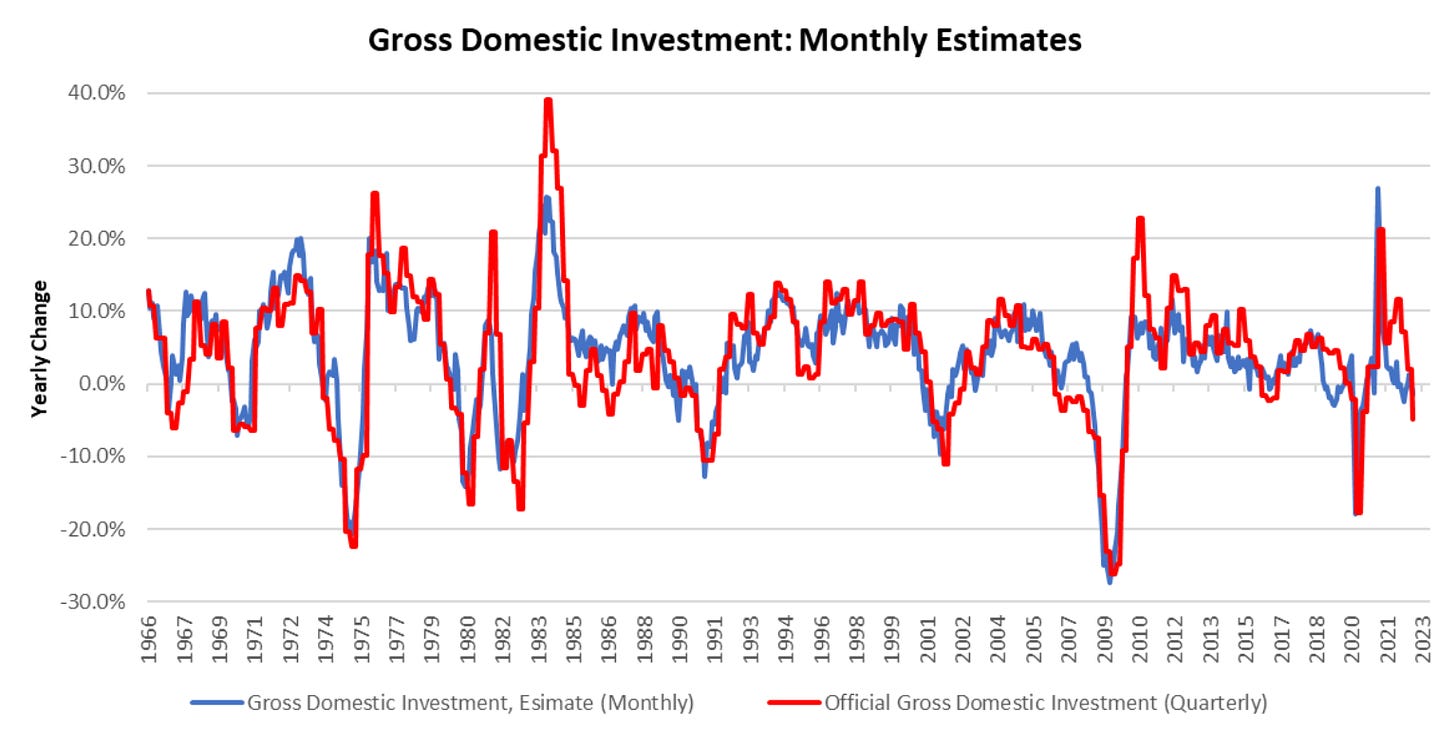
Which overall, contributed to a worsening of our tracking of real gross domestic investment:
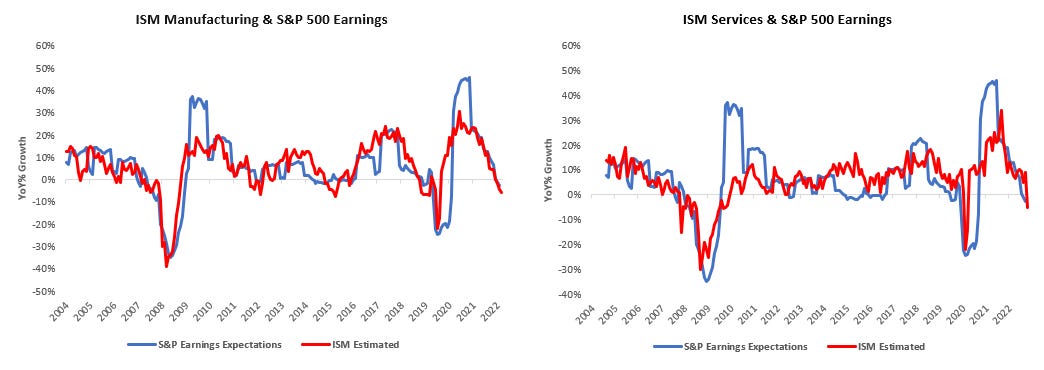
We also witnessed significant weakness coming from both ISM manufacturing and services data. Both numbers were in contractionary territory, and the implied path for S&P 500 earnings expectations is a contractionary one:
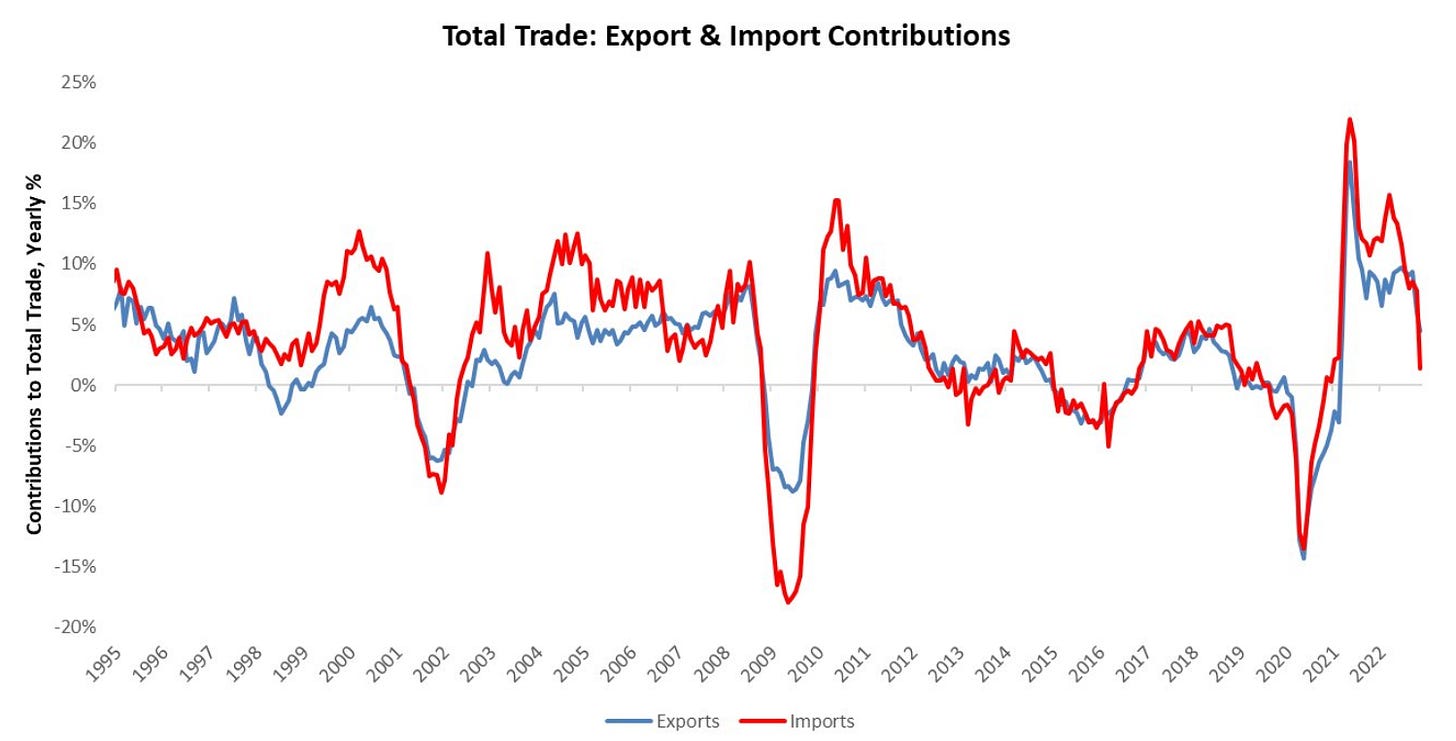
Trade balance data came in bucking this trend and adding to GDP in Q4 2022. However, the devil is in the details here. While the balance of trade (exports minus imports) was additive to our tracking of GDP— the overall volume of trade declined. Furthermore, the balance of trade improved due to a worsening of import activity (spending) rather than from an increase in export activity (income). We show the contributions to trade activity below:
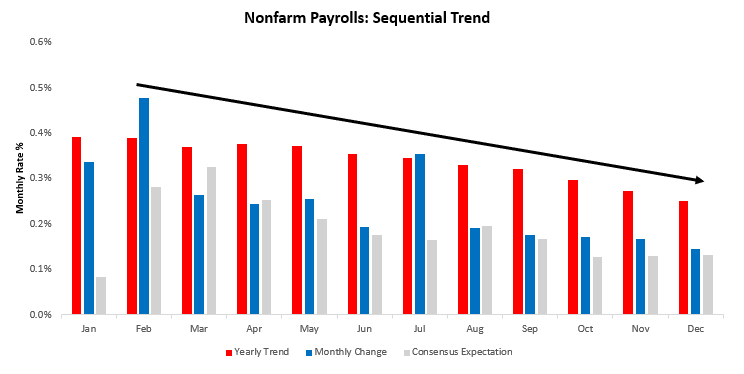
Nonetheless, these numbers will, on balance, be stimulative to both GDP and profitability. Finally, we had employment data, which continued to remain strong. The labor market remains resilient to deteriorating conditions, and this will likely continue until profits are adequately squeezed. However, we show note the marginal trend lower in labor market growth rates, which is consistent with the tightness in the labor market.
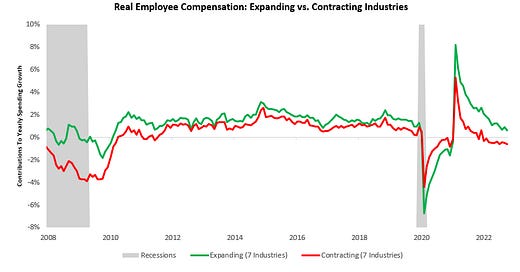
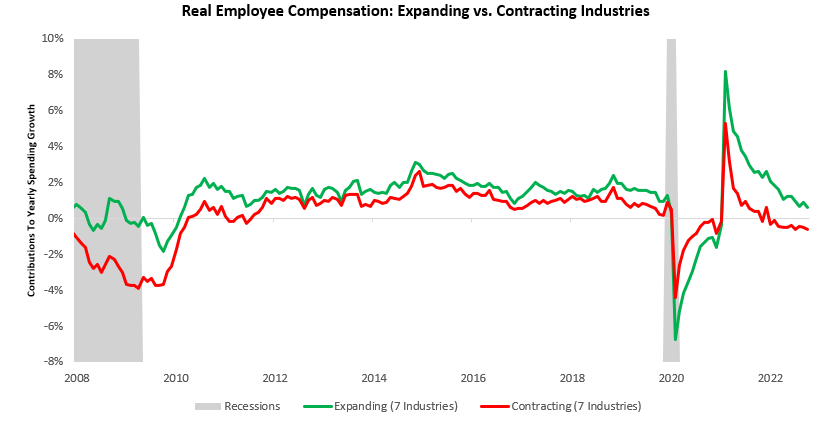
Finally, we think it is important to note that while aggregate labor data may look strong, our tracking of real employee compensation suggests a much more mixed picture under the surface. Approximately half of all industries are now seeing contracting real wages, which we visualize below:
Overall, the breadth of data this week suggests weakening business conditions. Export contributions have added to GDP, and if spending remains strong, this will net out to be supportive of profits. However, it is important to realize that periods of time when imports are most additive to GDP are when they are contracting; therefore, we should be careful in interpreting this data as overly beneficial to the profit outlook.
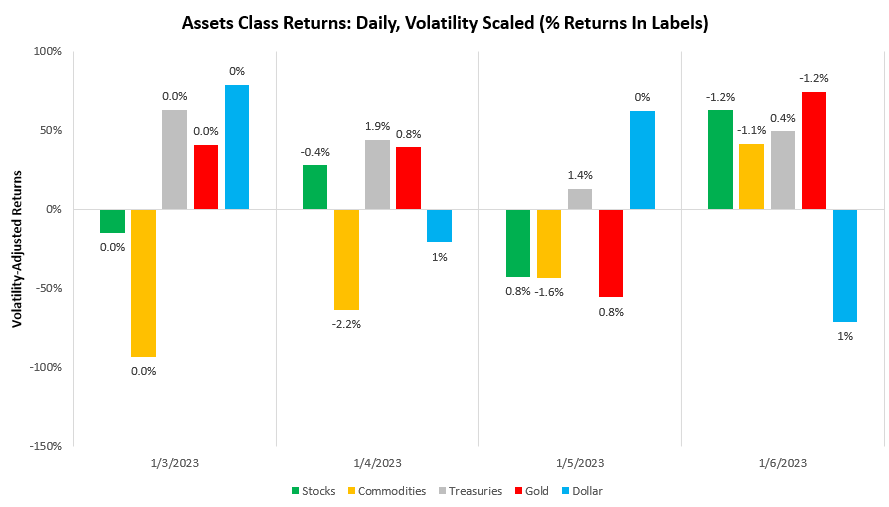
Within this context, our systematic allocations within the Prometheus ETF Portfolio suffered a loss of approximately -0.20% as it allocated to commodities. Markets large moved counter to this, with Treasuries & Gold offering this smoothest sailing last week:
Turning to next week, our systems have found tactical opportunities to bet on a potential disinflationary impulse that is developing as a function of weaker cyclical conditions by deploying risk in equities and fixed income. We show the Prometheus ETF Portfolio allocations below:
This portfolio allocation has an expected volatility of 7.5% and a maximum expected volatility of 10%. However, headed into a CPI week, the potential for these disinflationary bets to realize their maximum volatility is high. Therefore, we think it appropriate for users to use these tactical positions only if they can nimbly change direction. The equity positions, in particular, are in conflict with our growth expectations and are tactical expressions. We will skip our systematic asset commentary this week but will resume next week. Until next time.



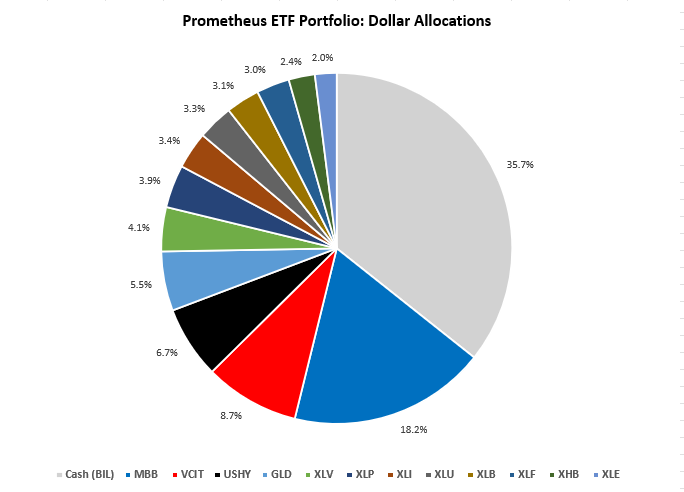
Could you add a pie chart with the top level asset classes in your ETF updates (equity, bonds, gold, commodities, cash, etc)? It would be useful to have them grouped at a top level when there are a lot of small sector allocations.
What does "first derivatives of inflation remain elevated" mean?