Last week we saw significant moves in markets. Equities and treasuries were down significantly, while commodities and the dollar rallied. These moves reflect the fundamental dynamics of heightened inflation, weakening growth, tightening liquidity, and market regime pricing for stagflationary nominal growth. These market moves came from weaker than expected employment data and higher-than-expected inflation in the form of CPI. We examine the drivers of asset returns individually:
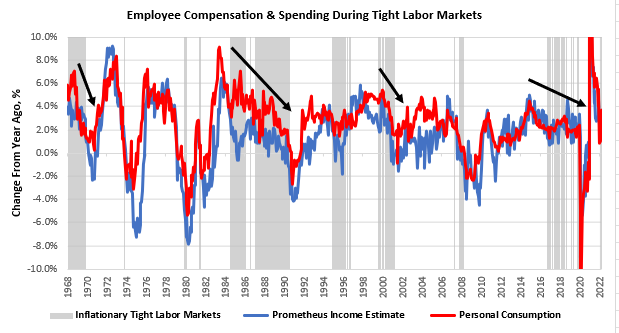
i. Growth remains under pressure. Economic cause-and-effect tell us that there is an increasing likelihood that growth will continue to weaken. Our focus is currently on the US consumer and how they will drive this economic cycle. Consumers spend (thereby creating income) in three ways: they can spend current income, borrow from future incomes, or dig into previously saved income. Current incomes are primarily a function of the number of hours worked, the prevailing rate of wages, and the employment in the labor force. We combine these estimates to get a sense of income-powering spending. We combine these measures with our systematic recognition of periods where labor markets are both tight, and inflation is elevated, i.e., inflationary tight labor markets. We show this below :
When labor markets are tight, employment becomes less of a source of incremental income, as there is less room to reduce unemployment. Furthermore, when inflation is elevated, real wages come under pressure, i.e., consumers have less spending power. Our year-over-year estimates show income declines of -3.1% during inflationary & tight labor markets, and real personal spending typically indicates a -1.8% decline annually. We are experiencing an inflationary, tight labor market, and we expect real incomes and spending to recede.
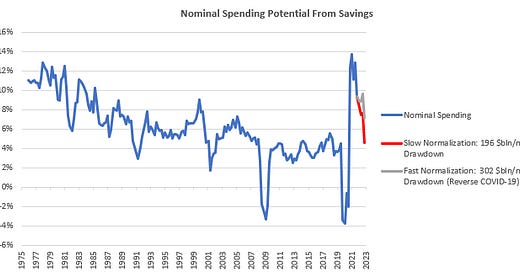
Household cash balances are elevated relative to the last five years. It is often argued that these are the buffer that will continue to support spending in the real economy. While some degree of this is likely, the magnitude of savings drawdown is unlikely to be adequate to offset income losses. Below, we show our estimates for the potential for savings to households to prop up personal spending, i.e., if households choose to reduce their cash balances, how much it would impact spending growth alone. We make room for a fast and slow scenario. In the slow scenario, households reduce their savings in line with historical rates. In the fast scenario, they reverse the uptick in cash balances since COVID-19 over 18 months. We show these below:
Even at a pace of $302 billion in cash balance drawdown, accumulated savings cannot keep up with the current rate of nominal spending growth. Now that we have covered current and previously saved incomes, we can look at the consumers’ ability to borrow from future income, i.e., credit. We show below how consumer credit growth is not large enough in value to contribute meaningfully to incomes. Furthermore, while credit is an essential feature of the US economy, credit occupying a large share of spending is typically a lagging indicator as it usually occurs during periods where income has contracted considerably. Keep in mind this takes into account only installment credit & not mortgages:
At best, credit could add approximately 0.3% to spending at its current levels. With net worths being impacted by declining asset prices and rising borrowing costs, we find even this to be an optimistic estimate.
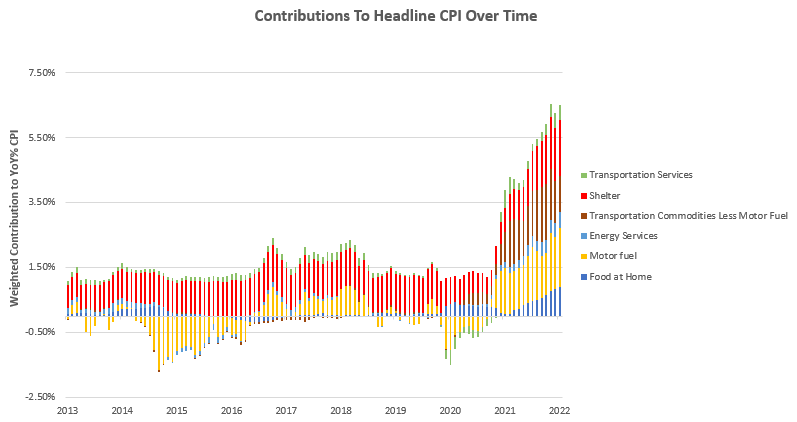
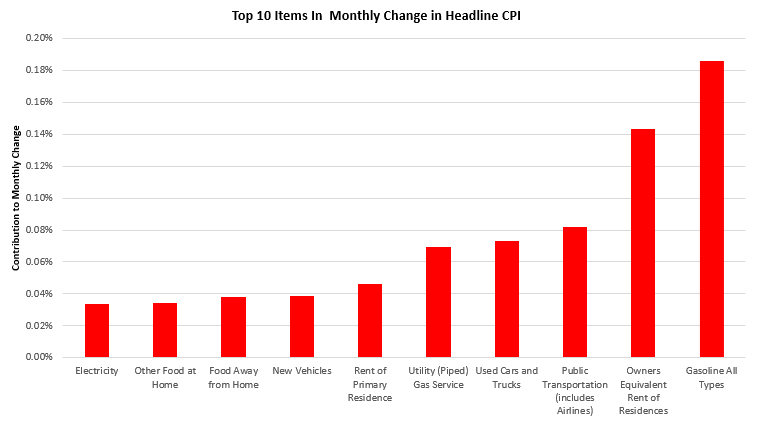
ii. Inflation remains resilient and has spread to areas where price increases tend to be sticky. CPI came in higher than expected, rising at a torrid 1% in May alone, benefitting our systematic exposures greatly. Energy, transportation, home prices, rents, and food prices were the most significant contributors to these moves. We show the top six categories over time below:
To showcase the contributions to the trends underlying current inflation, we show the contributions to the yearly changes in CPI:
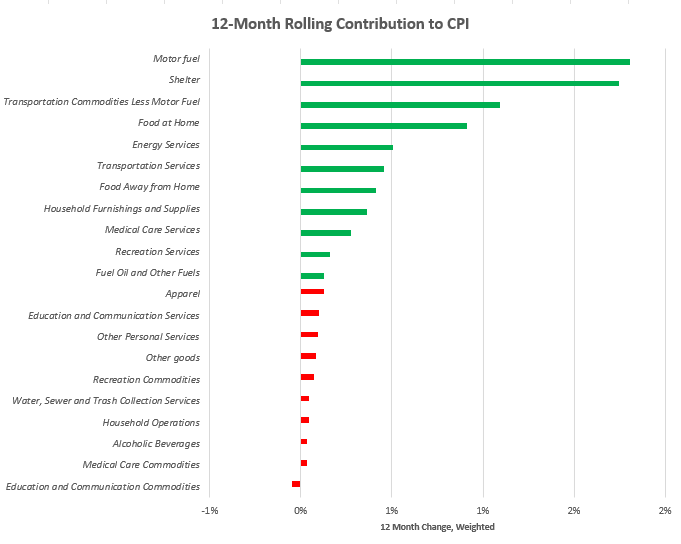
For more specificity, we show the top 10 items that contributed to the current monthly change:
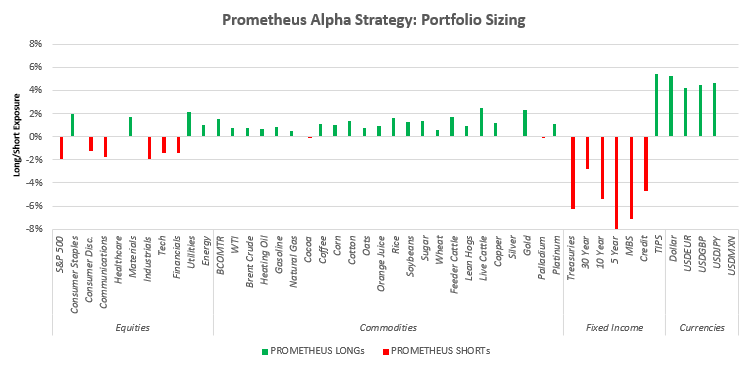
The primary concern we do not feel is adequately appreciated in markets today is that inflationary pressures have spread to items where inflationary tendencies do not revert quickly, i.e., food and housing. With sustained rental inflation, we could see a much higher mean CPI than markets are discounting, which would mean there is significant room for the current downtrend in stocks and treasuries. Our systems tell us to position accordingly, and we continue to short equities and stay long commodities and other inflation beneficiaries.
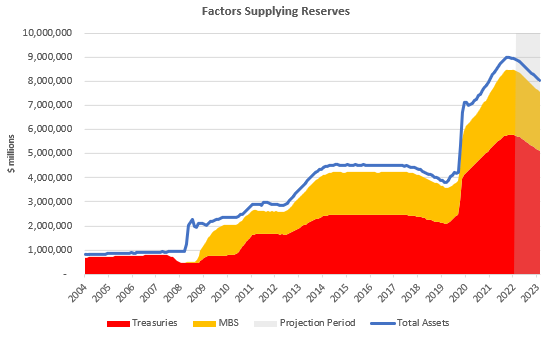
iii. Liquidity has begun to contract quickly and will continue to do so. The majority of the decline in liquidity year-to-date has come due to the pullback in fiscal largess. This month, we will see the initial impacts of the Fed’s balance sheet reduction. We show our forecasts below:
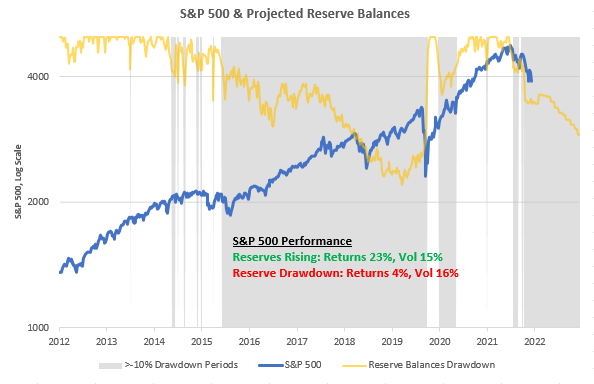
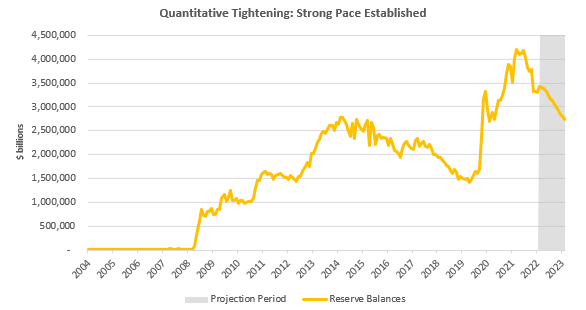
These asset decreases will decrease the reserve balances available to the financial system, decreasing liquidity and increasing volatility. We have long expected the tightening of liquidity conditions to be volatility-inducing and to drag on assets. The reduction of reserve balances (i.e., drawdown) has been true to form in this regard.
We show our projections of reserve balances below as well:
The Week Ahead
Taking all the information above into context, our systems continue to expect an environment of stagflationary nominal growth and weak liquidity. Historically, this has been a poor time for stocks & bonds, and current market trends continue to validate this assessment. In terms of economic data, we will receive a slew of incremental information next week. Furthermore, we will likely receive an additional 50 basis point rate hike on Wednesday at the FOMC meeting. Here are the upcoming data relevant to our systematic process:
Monday: NA
Tuesday: NFIB Small Business Surveys, PPI
Wednesday: FOMC, MBA Mortgage Applications, Empire Manufacturing, Retail Sales, NAHB Housing Index, Trade Prices
Thursday: Building Permits, Housing Starts, Philly Fed Business Outlook Survey, Jobless Claims
Friday: Industrial Production, Capacity Utilization, Mfg Production, Leading Index
We expect leading growth data like PMIs to paint a weak picture, while production data could continue to come in strong. We will carefully watch housing data to see if there is further deterioration in the housing outlook. In light of these fundamental and market conditions, our systems remain long inflation beneficiaries and short of assets that cannot survive this environment. Below, we show how our Alpha Strategy is positioned at the asset class level:
As we can see above, our systems remain aggressively short equities and fixed income while staying long dollars and commodities. Last week was a great week for this approach, and our systems continue to maintain the conviction that the environment has not materially changed yet. We show our exposures for the Alpha Strategies at the asset level below:
We continue to reiterate that this is a time for capital preservation and active shorting. Even if you aren’t generating returns on the short side, not losing money on the long side is also alpha. Stay nimble.






Thank you for this, it's incredibly beneficial.
FOMC coming up !!