Welcome to our official publication of the Prometheus ETF Portfolio. The Prometheus ETF portfolio systematically combines our knowledge of macro & markets to create an active portfolio that aims to offer high risk-adjusted returns, durable performance, & low drawdowns. Given its systematic nature, we have tested the Prometheus ETF Portfolio through decades of history and have shown its durability. For those of you who are unacquainted with our systematic process, we offer a detailed explanation here:
In this publication, we will discuss the performance, positioning, & risks of the Prometheus ETF Portfolio— and it will be published every week on Fridays to help investors understand how our systematic process is navigating through markets. Before diving into our ETF Portfolio positions, we think it is important for subscribers to understand the context within which our systems choose their exposures. Below, we offer our latest Month In Macro note, which contains the conceptual underpinnings of our systematic process within the context of the latest economic data:
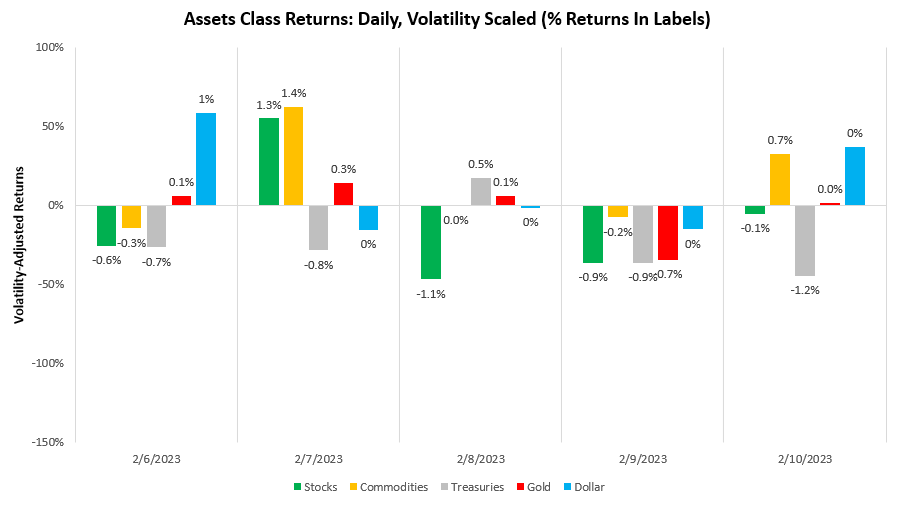
We highly recommend you get acquainted with our outlook to understand best our systematic positioning outlined in this note. This week saw markets move to reverse their disinflationary hue as Fed Chairman Powell gave the nod to the tight conditions of the labor market, hinting this could be the impetus for further tightening to come. Within this context, stocks and bonds performed poorly, while gold and commodities showed better performance:
While Chairman Powell indicated that a strong labor market might require more tightening, we expect that the labor market is unlikely to be the arbiter of whether we receive further rate hikes. At the end of the day, inflation is the target variable to be controlled. If inflation cools even amidst a tight labor market, policymakers will likely accept this outcome. The labor market is a driver of inflation but one amongst many in a complex economy. Therefore, we remain focused more on inflation data than labor data in assessing the Fed’s reaction function.
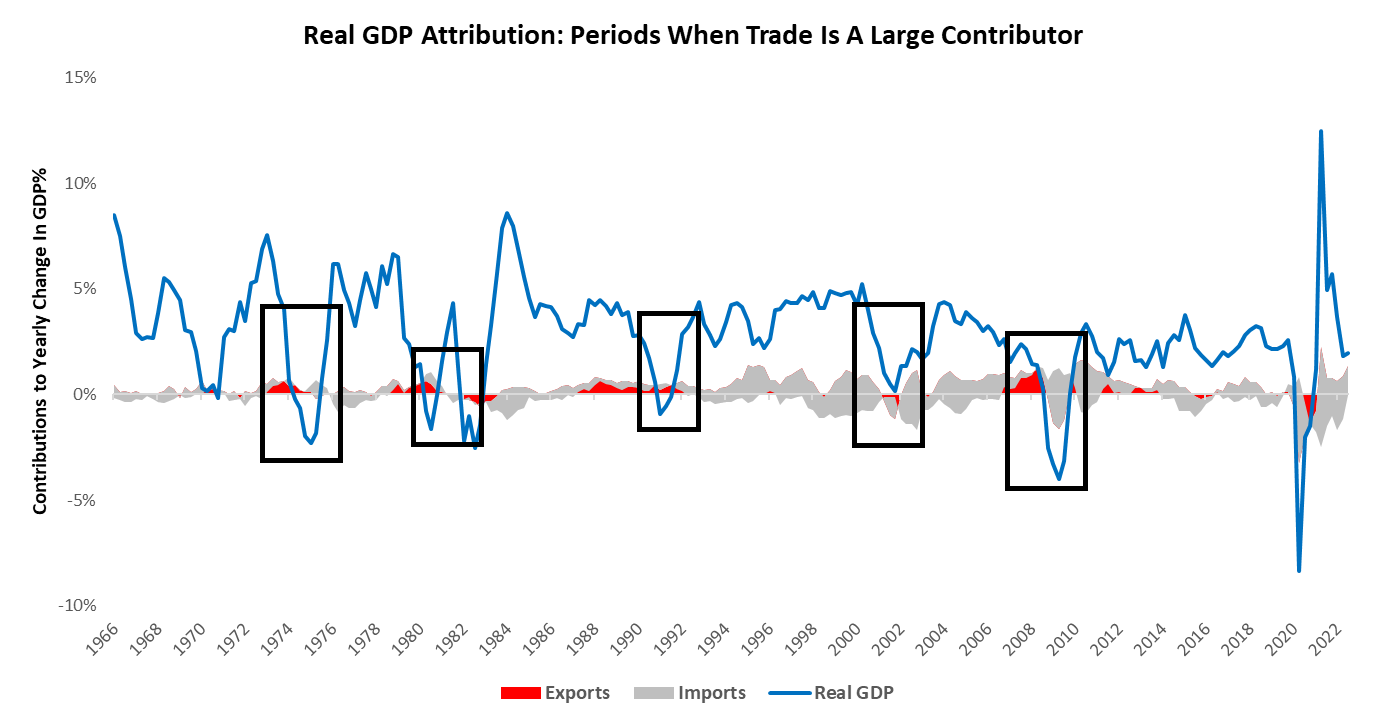
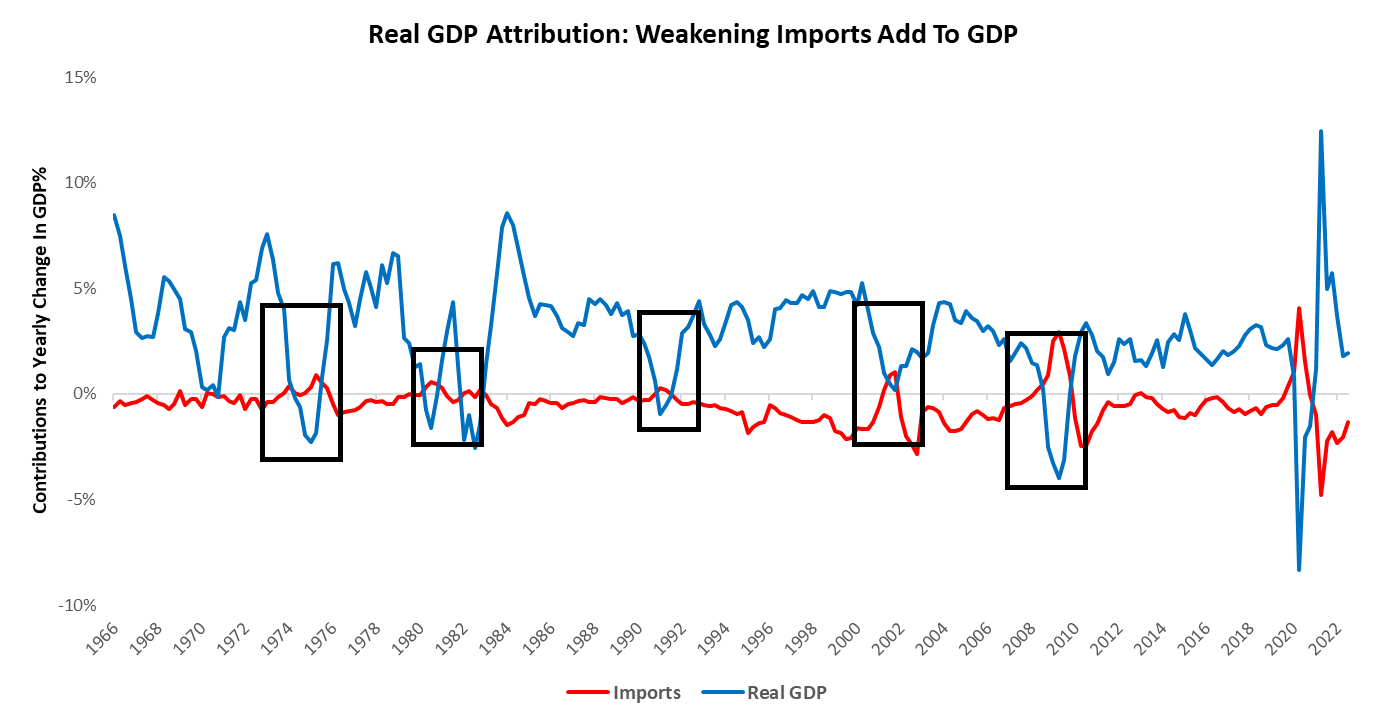
Alongside this expected policy change, we received new data in the form of US trade data, which looked additive to GDP on the surface. In the US, net trade activity is a small portion of the economy relative to domestic activity. However, the trade balance data has strongly contributed to the overall GDP & profit picture in the recent past. However, it is essential to recognize that in the US, the net impact of trade tends to be small on GDP. Most times, when it is a meaningful additive is during economic slowdowns. This is because pullbacks in domestic demand tend to support the trade balance. We show this impact below. As we can see, net trade is usually a meaningful driver prior to contraction:
Furthermore, this benefit to GDP primarily comes from the contraction in import activity:
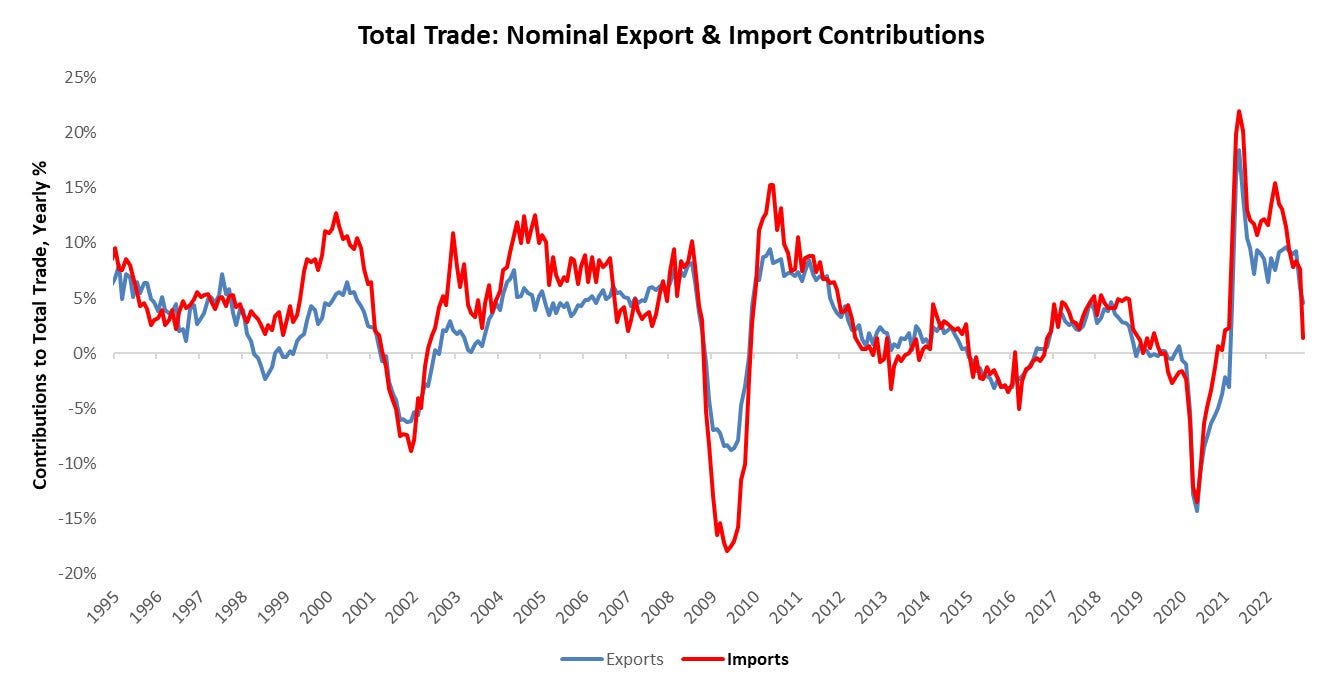
Taken in context, this latest trade data confirms what we see in the broader economy, i.e., a slowdown in nominal and real economic activity.
Therefore, recent trade data does not indicate significant strength in the economy either from the perspective of output or demand. This is consistent with our broader tracking of economic conditions, suggesting more weakness. As we progress towards a potential contraction, we may further see trade data support GDP. However, this will not be a picture consistent with economic strength but just a function of the relative rate of change and the fact that contracting imports will be additive.
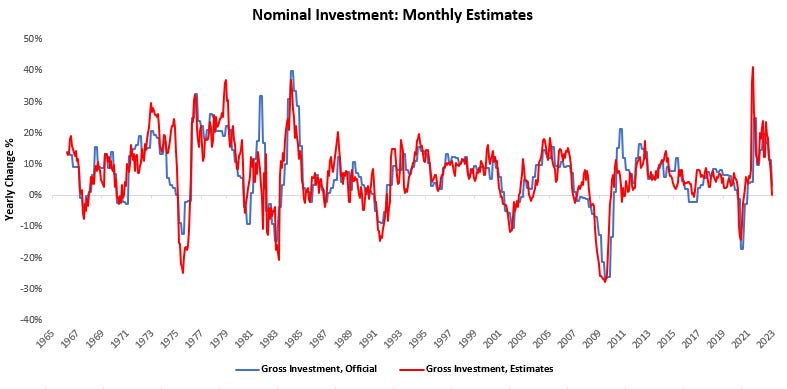
In addition to this trade data, we received incremental information from businesses on their inventories. The latest inventory data continues to show an inventory drawdown, which is consistent with our business sales tracking. This declining inventory is broad-based and reflects the weakness we see in the business sector. These declines further weaken our monthly monitoring of total investment, which is now in contraction on a nominal basis:
Since 1948, there have been only four instances where a contraction in nominal investment has not resulted in a contraction in a recession, and the current situation bodes ill for the broader economy.
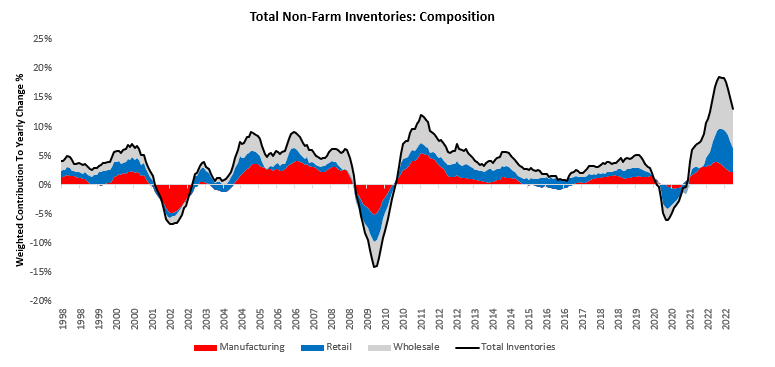
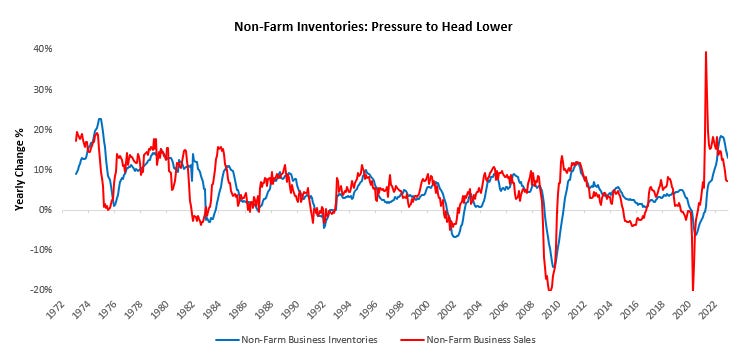
To offer some detail on the latest inventory data— wholesale inventory data surprised expectations, with a monthly change of 0.1% versus the expected 0.1%. This data resulted in a 0.26% increase in total nonfarm inventories- with manufacturing, retail, and wholesale contributing 0.12%, 0.16%, and 0.02%, respectively. Over the last year, manufacturing, retail, and wholesale have contributed 2.21%, 4.13%, and 6.37% to a 12.99% increase in nonfarm inventories:
Total business sales are currently below the rate of change of inventories, suggesting downward pressures on future inventory growth. The gap between sales & inventories is significant relative to history, suggesting strong downward pressure on inventories:
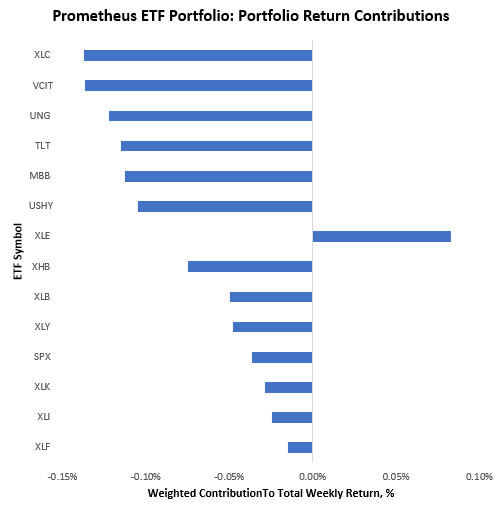
Therefore, while markets moved to react to a tight labor market and potentially tighter monetary policy, the economy continued to deteriorate on a nominal basis. Amidst this divergence between market pricing and incremental data, the Prometheus ETF Portfolios bet on slowing inflation suffered a 0.8% loss this week. This loss was well within the range of expected portfolio outcomes, and therefore we see little cause for concern. Below, we show the attribution of this week’s performance:
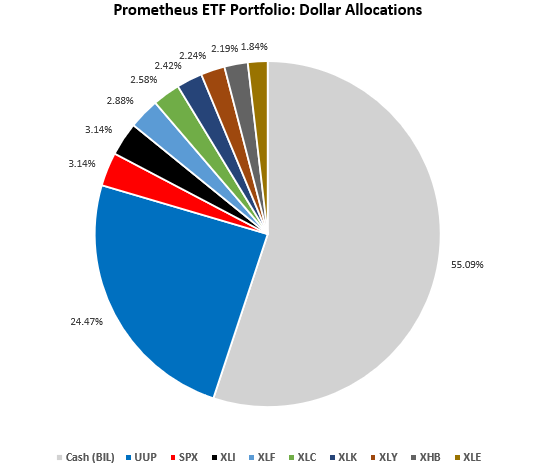
Turning to next week, our systems are looking to position as follows:
Positions: Cash (BIL): 55.09% UUP : 24.47% SPX : 3.14% XLI : 3.14% XLF : 2.88% XLC : 2.58% XLK : 2.42% XLY : 2.24% XHB : 2.19% XLE : 1.84%
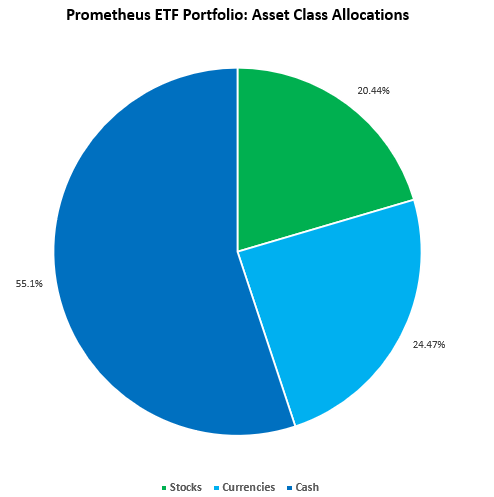
At the asset class level:
This allocation has an expected volatility of 8% and a maximum volatility of 10%. Next week, CPI is likely to be the dominant mover of asset markets. An upside surprise will likely prove challenging for our equity holdings and positive for the dollar, while a downside surprise would likely do the inverse. Therefore, we think there is limited potential to achieve maximum volatility. We will provide guidance on CPI ahead of the print, per usual.
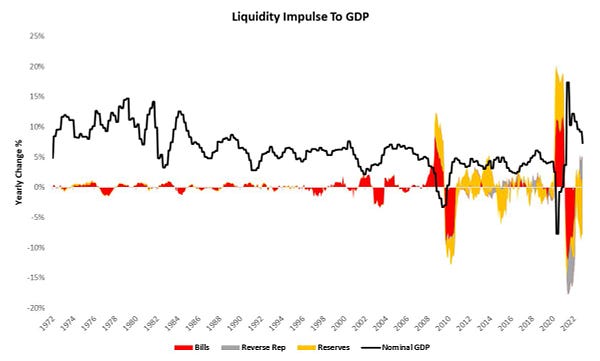
Our renewed bet on the dollar reflects market pricing, which has once again moved towards pricing tightening liquidity conditions as the Treasury ramps up issuance while reducing bill supply. For a primer on the mechanics at play, you can reference a recent Twitter thread:

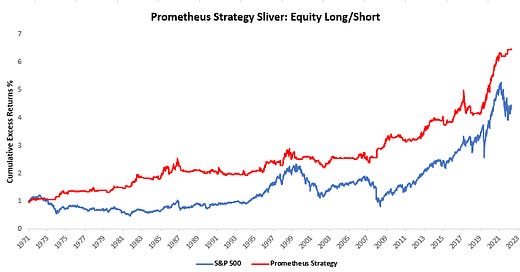
While our bet on the dollar reflects our system betting on lower liquidity, our bet on stocks reflects a bet on lower inflation. We have received several questions on our positioning in stocks, despite our expectations for a growth slowdown. We think it is important to clarify. Markets price various economic drivers (growth, inflation, and liquidity) to varying degrees over time. While our expectations may be for weakening growth to become the dominant driver of markets, we are not seeing pricing consistent with this expectation yet. However, we also expect inflation to slow and stabilize— and markets have moved incrementally to price this expectation as CPI has come in lower. As a result, our systems have chosen to ride this disinflationary wave as we attempt to perform in all environments. This has been a net benefit to portfolio performance. However, this should not be interpreted as bullishness on the economy. For further clarity, we show one of our strategies that uses our process to trade the S&P 500:
The above strategy uses the same rules that our ETF Portfolio uses to trade assets, with some differences in sizing and leverage. As we can see above, the strategy has generally performed well. However, what we wish to underscore is that in the current context, this strategy currently has a 17% exposure to the S&P 500. This low positioning reflects the relative cross-currents in signals, reflecting an environment that is not ideal for taking significant risks. This low signal is also reflected in our aggregate positioning, with equities commanding a small share of total exposure. In summary, our systems are playing for a bout of disinflation, but as markets begin to shift from inflation concerns to growth concerns, our positioning will likely shift. We take advantage of the opportunities markets provide us. Until next week.




Excellent commentary as usual!
Somewhat surprised to see your FI exposure reduced to zero just as:
1.. Market likely transition from a laser focus on inflation to growth.
2. The recent run-up in yields (particularly in the back end) that creates a nice asymmetric set-up for entry into a duration position.
Nice write up.
Just wanted to clarify my understanding of your return contributions calculations, which price assumptions do you make?
Are you entering at Friday close levels or Monday morning open? and selling at which levels?
Thanks