Welcome to our official publication of the Prometheus ETF Portfolio. The Prometheus ETF portfolio systematically combines our knowledge of macro & markets to create an active portfolio that aims to offer high risk-adjusted returns, durable performance, & low drawdowns. Given its systematic nature, we have tested the Prometheus ETF Portfolio through decades of history and have shown its durability. For those of you who are unacquainted with our systematic process, we offer a detailed explanation here:
In this publication, we will discuss the performance, positioning, & risks of the Prometheus ETF Portfolio— and it will be published every week on Fridays to help investors understand how our systematic process is navigating through markets. Before we dive into our ETF Portfolio positions, we think it is important for subscribers to understand the context within which our systems are choosing their exposures. Below, we offer our detailed Month In Macro note, which contains the conceptual underpinnings of our systematic process within the context of the latest economic data:
Turning to the week that was— asset markets have moved to reflect the initial stages of a nascent turning point— one where the principal driver of market moves transitions from inflation volatility to growth volatility. To elaborate: volatility in economies and markets creates conditions whereby future conditions are less likely to be like the recent past. These dynamics, while intuitively understandable, are hard to visualize and quantitatively account for. As a result, consensus expectations in markets are primarily a function of extrapolating the most recent past into the future. When we enter periods of high volatility (in growth, inflation, liquidity, etc.), the potential for economic surprises widens. As markets are discounting machines, unexpected events create significant moves. 2022 was a case in point— market expectations of inflation were persistently shocked due to extreme inflation volatility created by both cyclical and idiosyncratic factors, causing a historic sell-off in fixed income.
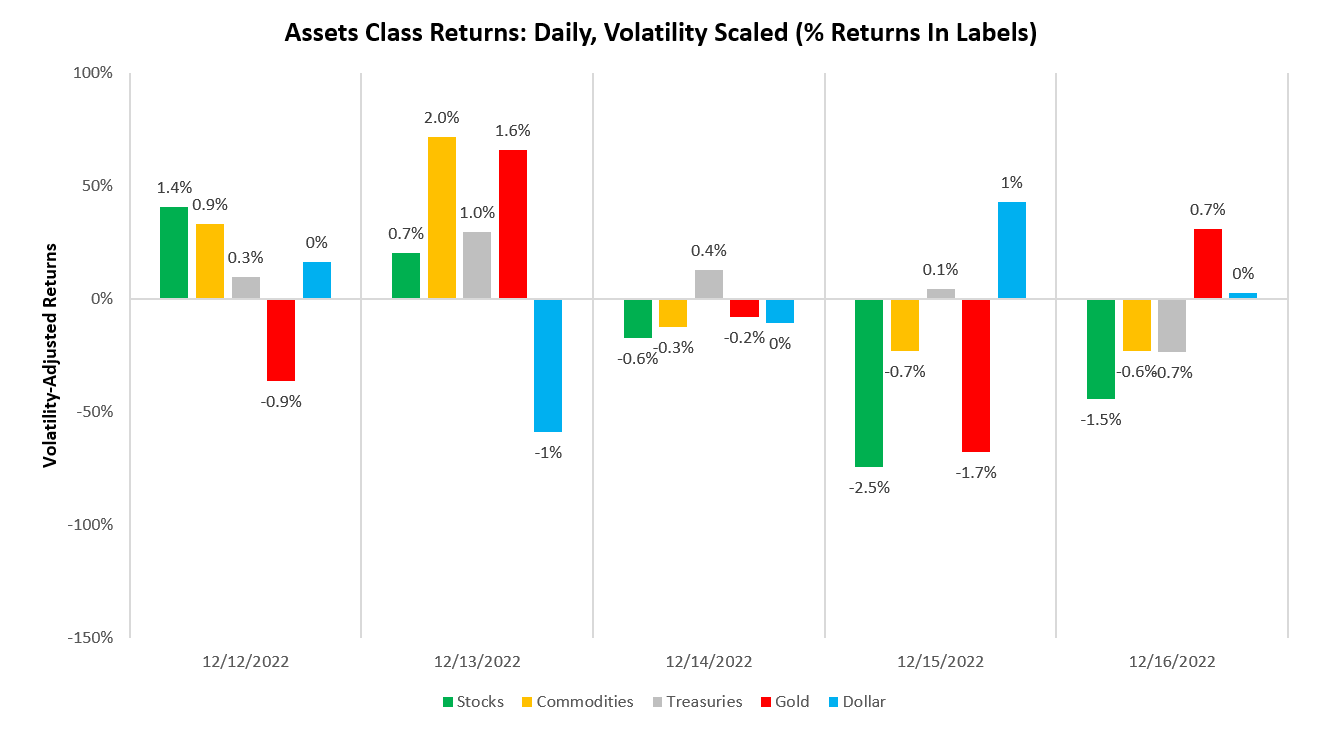
In today’s context, our tracking of conditions continues to show that conflicting economic pressures are ameliorating inflationary pressures today. Continuing down the path will suggest an inflation trend of 3.5% to 4.5%. Crucially, resilient segments of the services economy are likely to support inflation, while weaker areas of the goods economy are likely to detract from inflation. The combination of these factors creates an environment where inflationary pressures are likely to be muted relative to those we have witnessed in H1 2022. However, the evolution of economic conditions increasingly suggests both a profit recession and, now, a GDP recession are incoming. Within this context, we entered the Prometheus ETF Portfolio long fixed income, gold, silver, and select agricultural commodities. Below, we show the evolution of asset classes over the last week:
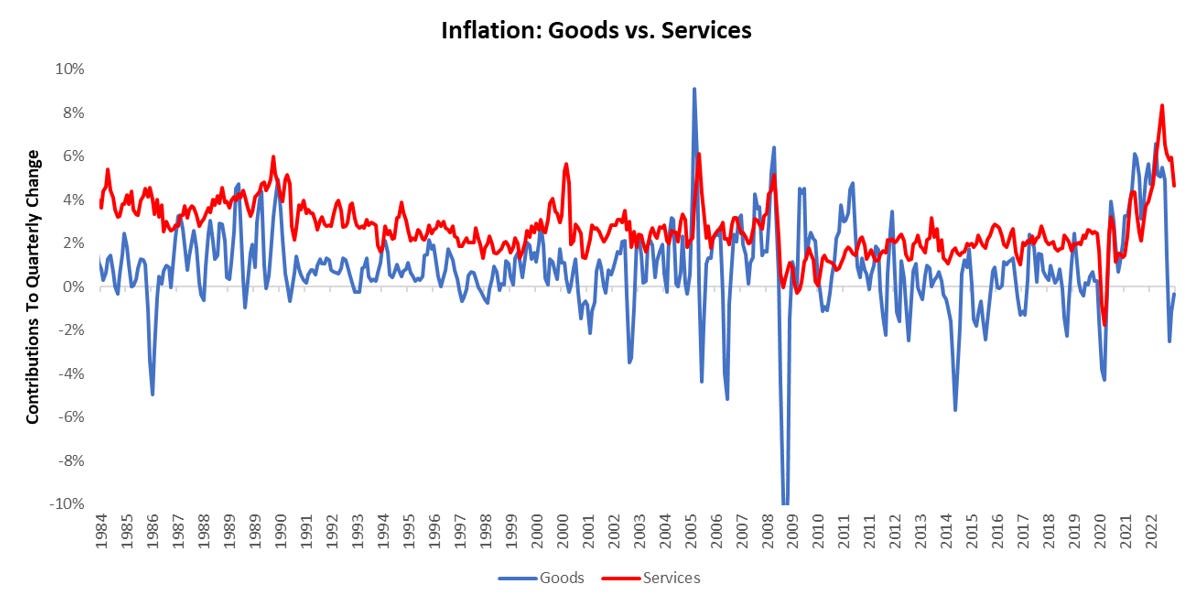
Consistent with our expectations of the inflation trend, we entered the week with a view that CPI would come in at 0.39% on Tuesday— higher than expected by consensus. Our models proved incorrect in this expectation. CPI came in significantly lower than our expectations and those of consensus. The primary driver of this divergence was unexpected services deflation, primarily coming from Medical Care and Energy Services. Housing, durable goods, and nondurable goods were within the range of expected outcomes and consistent with broader pressures. The goods economy continues to feel pressure, with the potential for this pressure to spread to the broader economy. We show Goods vs. Services inflation below:
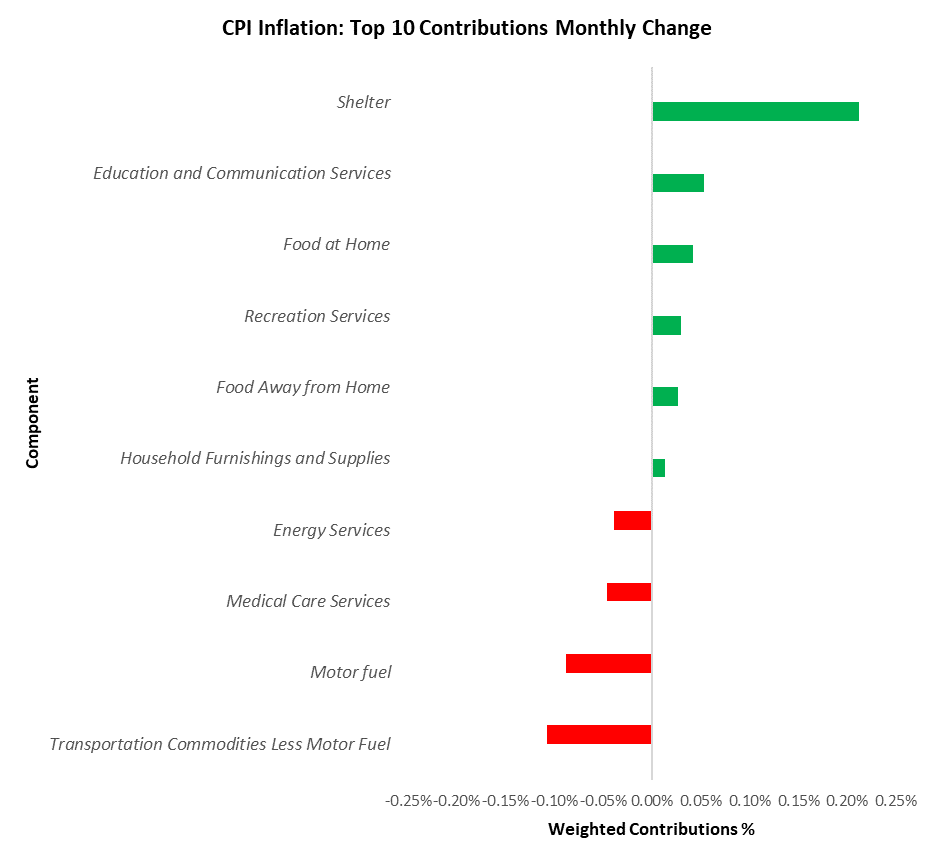
The primary drivers of this print were Motor fuel (-0.09%), Transportation Commodities Less Motor Fuel (-0.11%), Shelter (0.21%), Medical Care Services (-0.05%), & Education and Communication Services (0.05%). Below, we show the top 10 drivers of the monthly change:
We guided those with discretionary ability to trade the event to reduce exposure. While this proved less than maintaining exposure consistent with the systematic construction ex-ante, we think it remained prudent to provide this information.
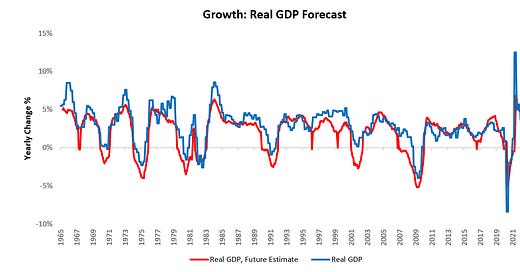
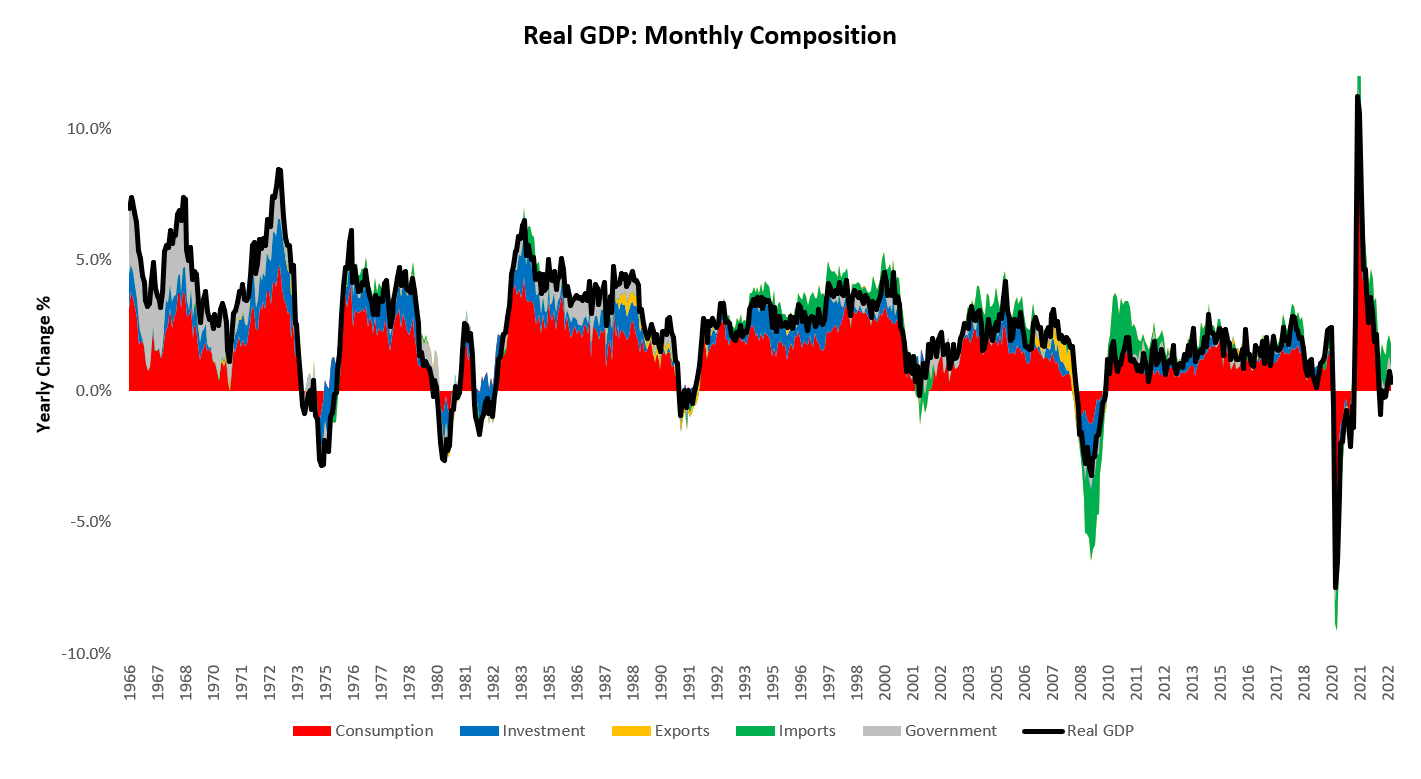
Following CPI, we had the Federal Reserve come out with a 50 basis point hike to interest rates, alongside a strong message from Jerome Powell that the Fed would like to see a sustained tightening of financial conditions. This messaging is consistent with our expectations, i.e., the Federal Reserve will likely lean on maintaining interest rates at a high level to achieve this tightening rather than accelerating the pace or size of further hikes. Our assessment of economic conditions suggests that the initial conditions required to facilitate contraction in economic growth and stabilization of inflation (though far from the 2% target) are already in place. Our systems are now moving to estimate a GDP contraction in the coming quarters; we show this below:
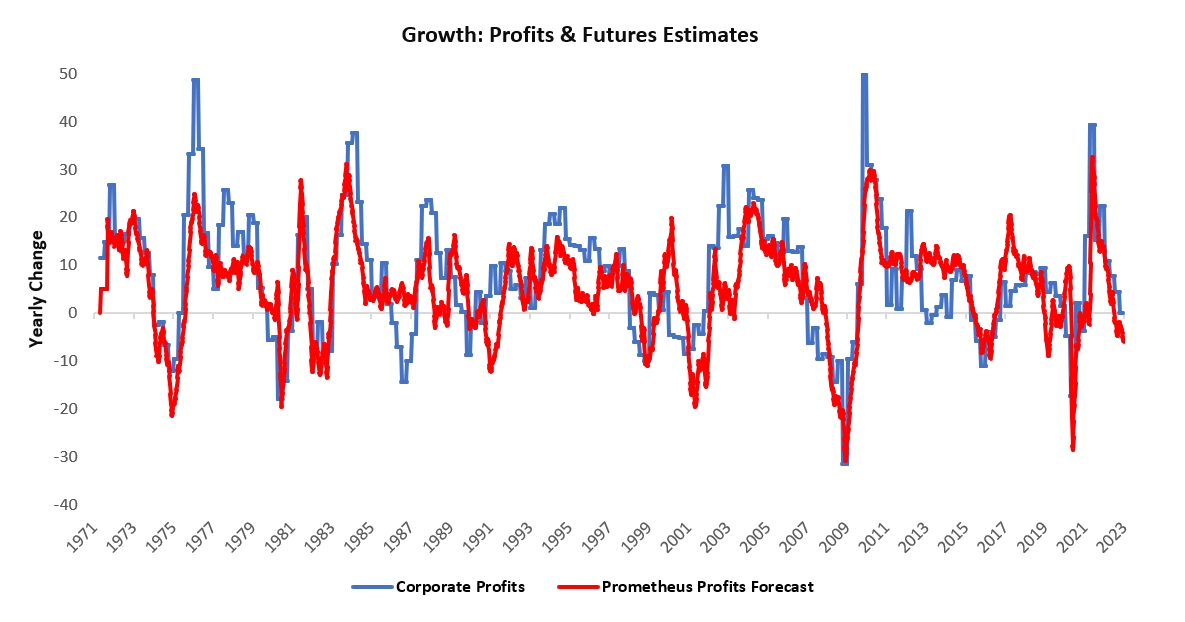
These expectations of a potential real GDP contraction come alongside expectations of a nominal profit contraction:
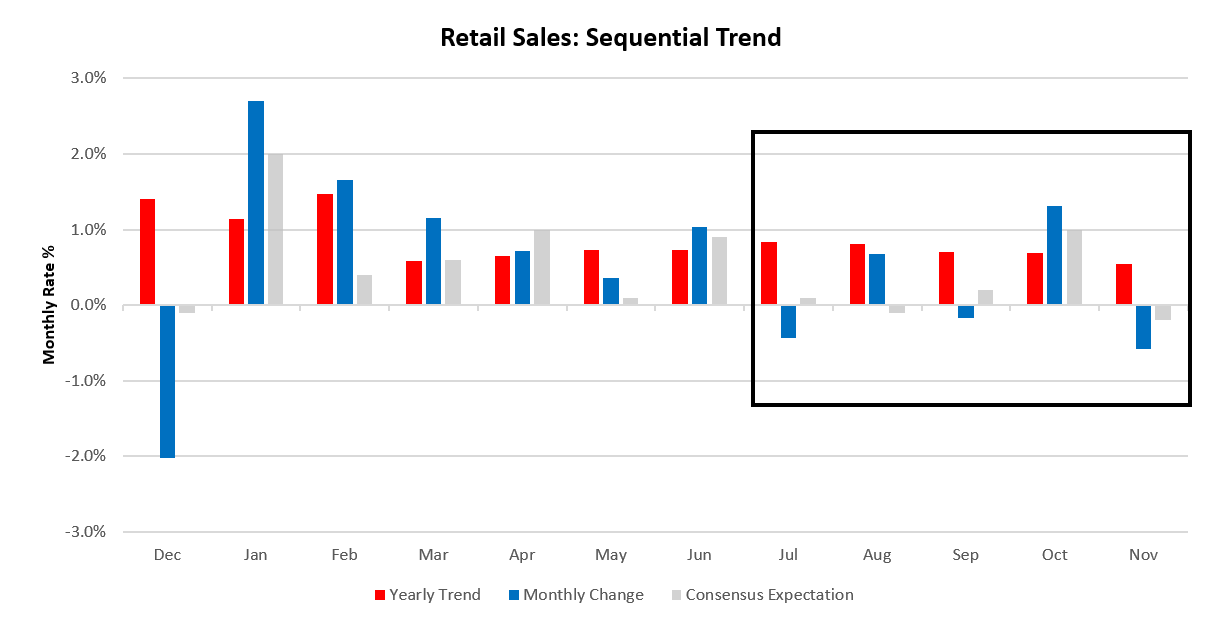
Incremental data this week have brought our tracking of economic conditions further in line with these future estimates. Both retail sales and industrial production showed contractionary prints this week. Below, we offer the sequential evolution of both, starting with industrial production:
As we can see above, the trend in production continues to weaken, and as base effects from earlier in the year fade, conditions are lining up for production to contract in 2023. Next, we show nominal retail sales:
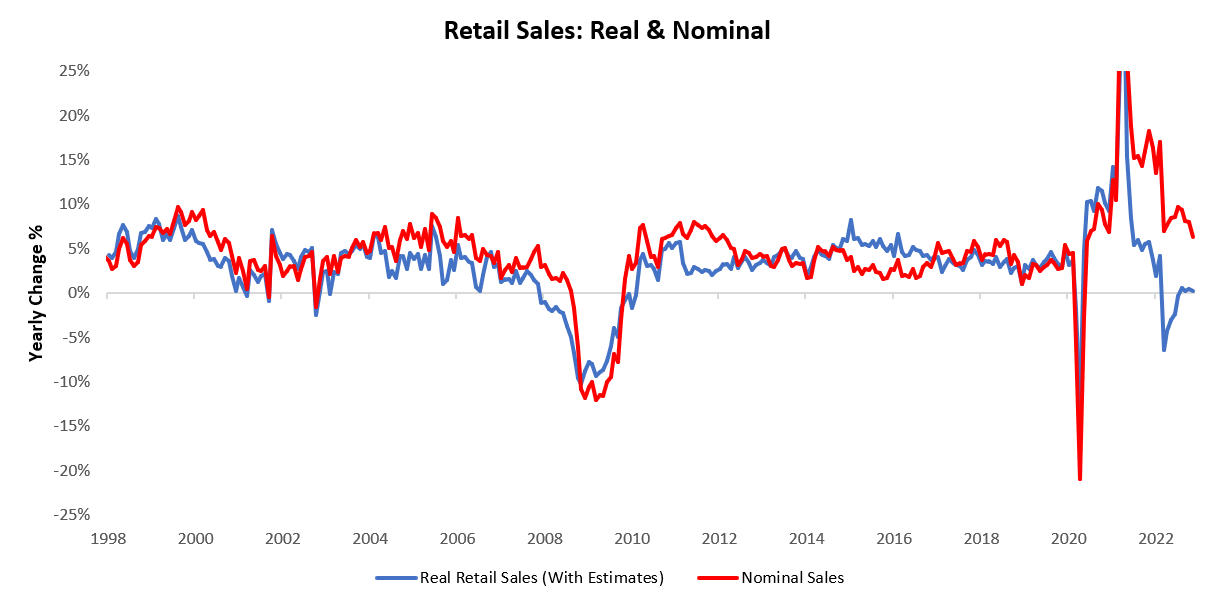
Keep in mind, the sequential shown above are nominal, with real data significantly worse:
The combination of these factors leads our tracking of real GDP lower, now consistent with real GDP of 1% versus one year prior:
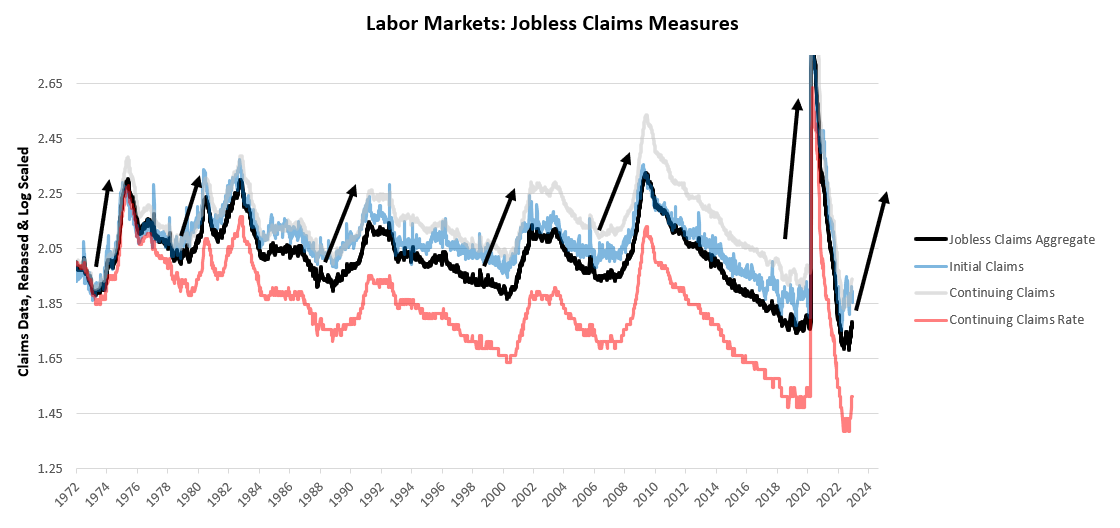
We remain on the path towards contractionary activity, with industrial production now conforming with our expectations alongside weaker consumption. Export activity will likely follow. Our attention now shifts toward the labor market, which remains the stronghold of economic output. The potential for volatility in the labor market has built over the year, and the potential for weaker employment is considerable.
We reiterate that the moves in the labor market tend to be nonlinear, with weakening labor markets moving at multiple times the speed and size of strengthening ones. We will continue to monitor these dynamics carefully as we progress through the cycle. We now turn to our positioning.
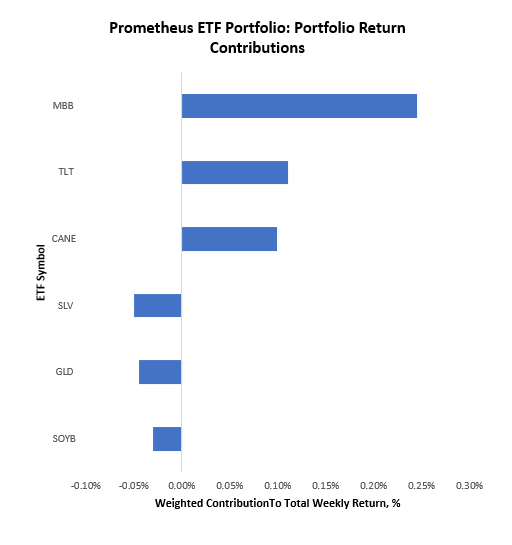
The Prometheus ETF Portfolio ended the week up 0.30%; we show the contributions to this return below:
The key takeaway from this week’s performance is the positive contribution of fixed income amidst a tough week for equity markets. As we mentioned in last week’s note, change is afoot in markets, and our systems have been ahead of the initial phases of this change thus far.
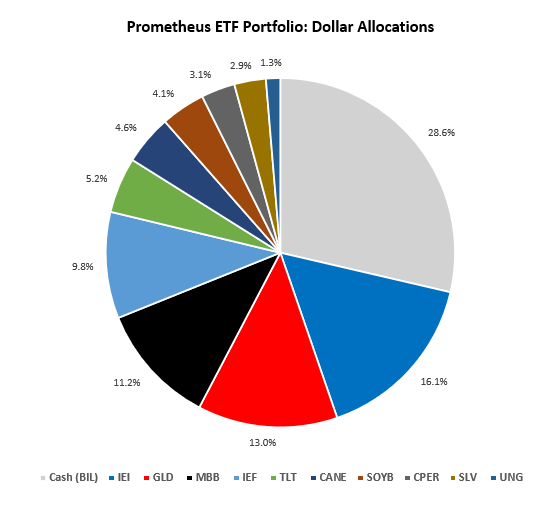
Turning to next week’s allocations, the Prometheus ETF Portfolio will be looking to position as follows:
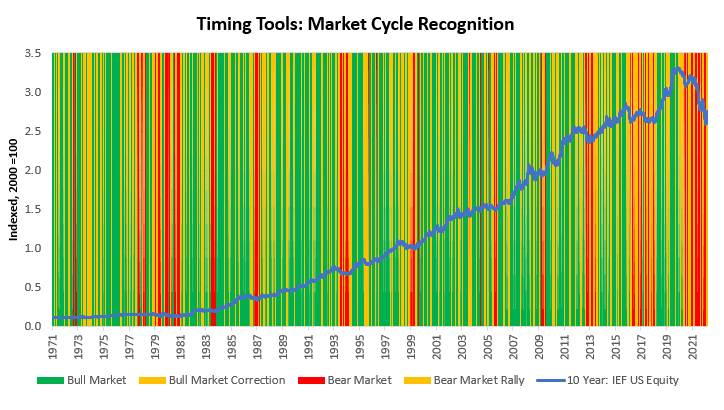
This allocation has an expected annualized volatility of 5.9% and a maximum volatility of 10%. The added diversity of bets creates conditions wherein maximum volatility is less likely to be achieved, allowing those who wish to add exposure the potential to do so. For additional color, we share some of our market timing tools to help contextualize the positions within the broader economic context.
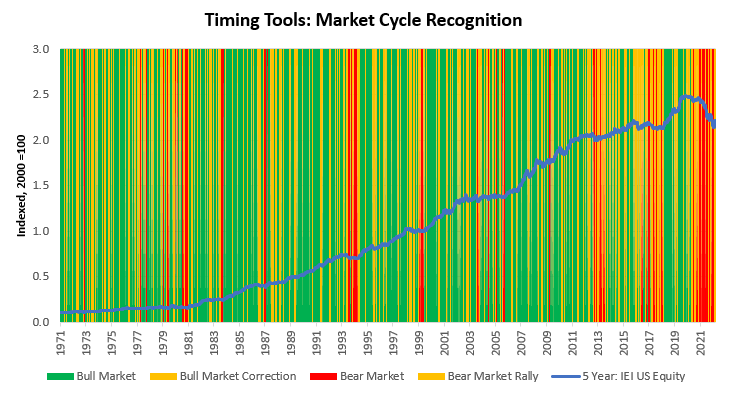
IEI: 7-10 Year remains in a Bear Market Rally. Bear market rallies can initiate regime change, and current market pricing suggests beta capture opportunities.
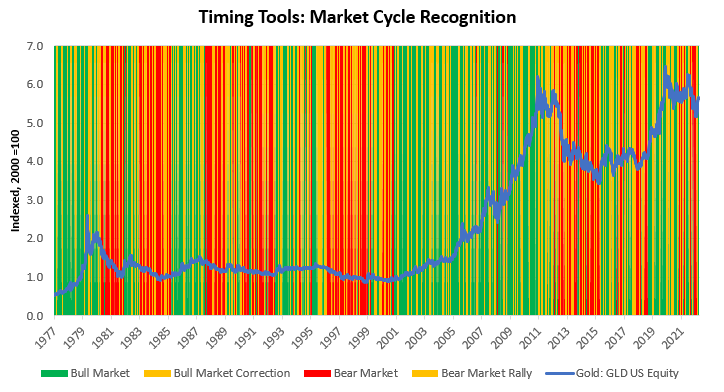
GLD: Gold has transitioned into a Bear Market Rally from a Bull Market. Bear market rallies can initiate regime change, and current market pricing suggests beta capture opportunities.
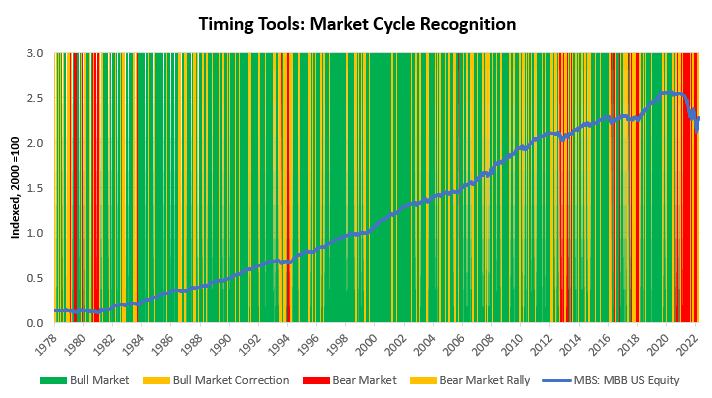
MBB: MBS remains in a Bear Market Rally. Bear market rallies can initiate regime change, and current market pricing suggests beta capture opportunities.
IEF: 5 Year remains in a Bear Market Rally. Bear market rallies can initiate regime change, and current market pricing suggests beta capture opportunities.
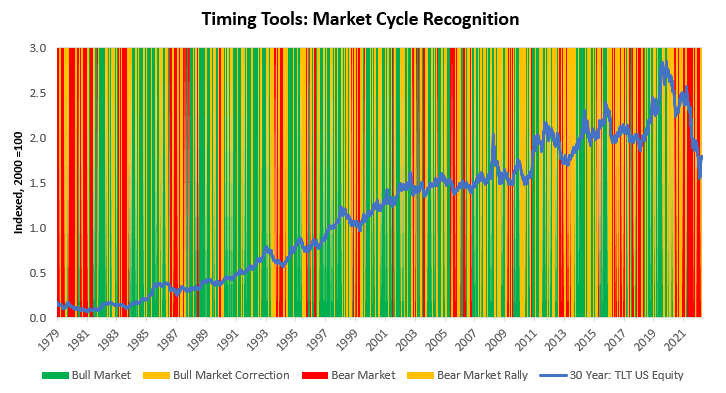
TLT: 30 Year remains in a Bear Market Rally. Bear market rallies can initiate regime change, and current market pricing suggests beta capture opportunities.
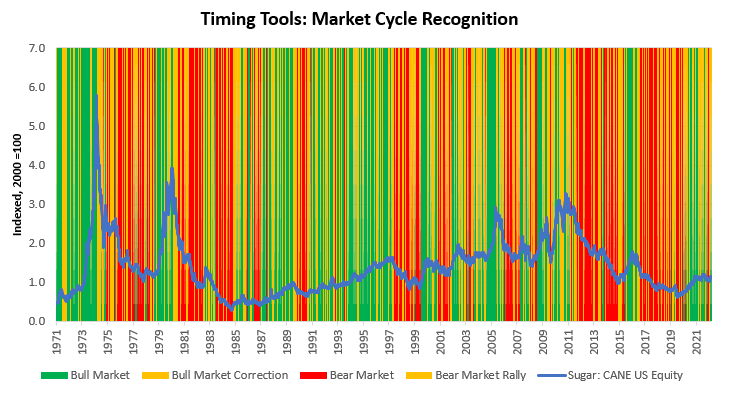
CANE: Sugar remains in a Bull Market. Consistent with this, current market pricing suggests beta capture opportunities.
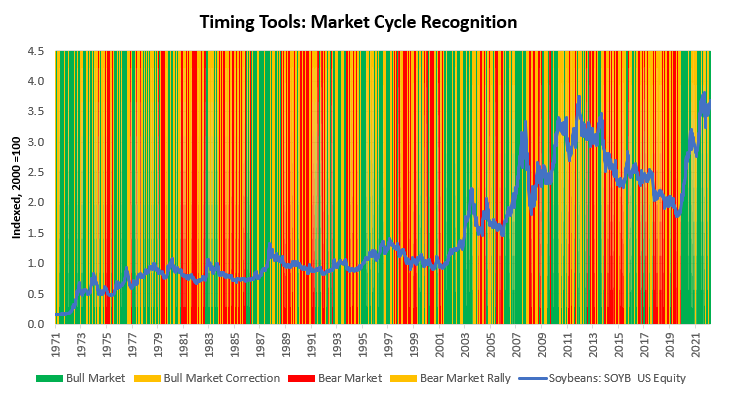
SOYB: Soybeans remain in a Bull Market. Consistent with this, current market pricing suggests beta capture opportunities.
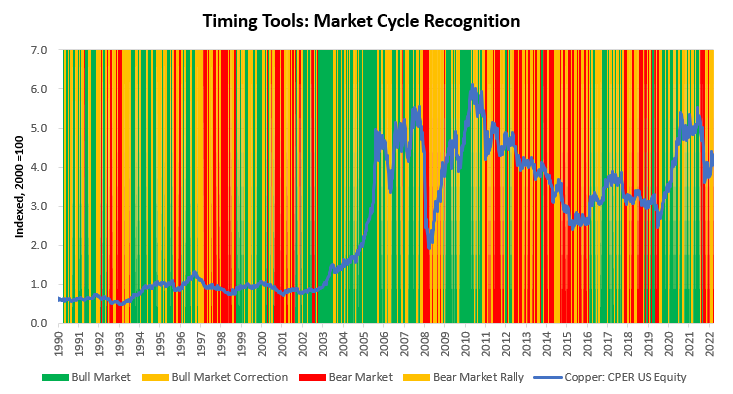
CPER: Copper remains in a Bear Market Rally. Bear market rallies can initiate regime change, and current market pricing suggests beta capture opportunities.
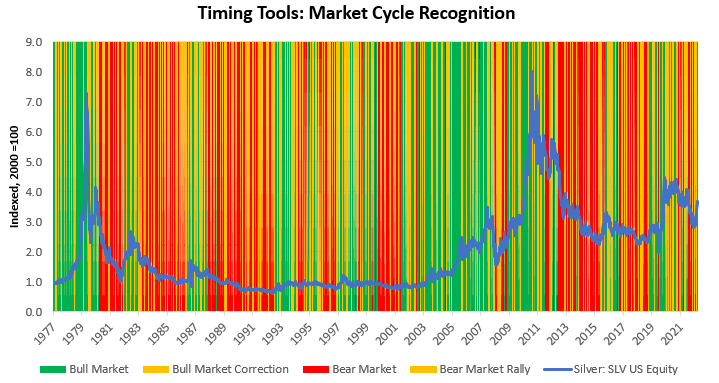
SLV: Silver remains in a Bull Market. Consistent with this, current market pricing suggests beta capture opportunities.
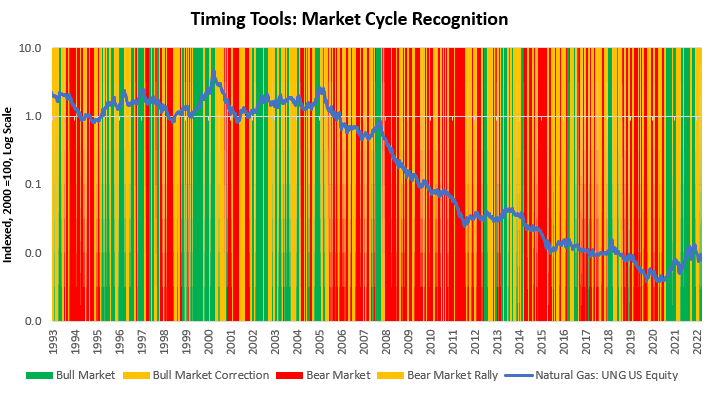
UNG: Natural Gas has transitioned into a Bull Market Correction from a Bull Market.
Overall, market and macro conditions continue to tell us that we are at a point where future economic conditions could potentially evolve in a very different manner than they have in 2022. We must manage risk consistent with these conditions. Until next week.





Lovely stuff, thanks for taking the time to update your portfolio.
One question with respects to gold allocation, I presume gold enhances the likelihood of a positive return within the ETF... or limits drawdowns?
With rates set to stay higher for longer what's the thought process for including it within the ETF?
Many thanks,
Phil