


Prometheus ETF Portfolio 3.0
Strategy Upgrades & New Positions

Prometheus ETF Portfolio was our first retail strategy, launched in November 2023. The strategy has achieved our goal of achieving strong risk-adjusted returns relative to cash with limited capital drawdowns in depth and duration. We show the inception-to-date performance of the strategy below:
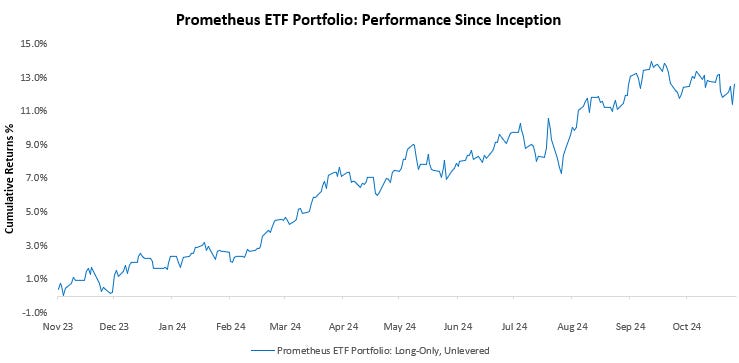
Prometheus ETF Portfolio aims to allow everyday investors to access an investment solution that combines active macro alpha, passive beta, and strict risk control, all in an easy-to-follow, low-turnover solution. Thus far, we have been successful in generating these outcomes. However, innovation has been the cornerstone of our evolution, and we’re constantly pushing forward our understanding of macroeconomic dynamics to further our edge in markets. A key driver of this evolution is our iterative research process, where we try to systematize our ongoing understanding of macro conditions into investment strategies. Keeping with this process over the years has allowed us to upgrade our understanding and, in turn, our strategies.
Today, this iterative process has allowed us to bring you Prometheus ETF Portfolio 3.0. Prometheus ETF Portfolio 3 .0 rotates between SPY, TLT, DBC, IAU, and cash to outperform beta over time. We show our simulations for Prometheus ETF Portfolio 3.0 below:
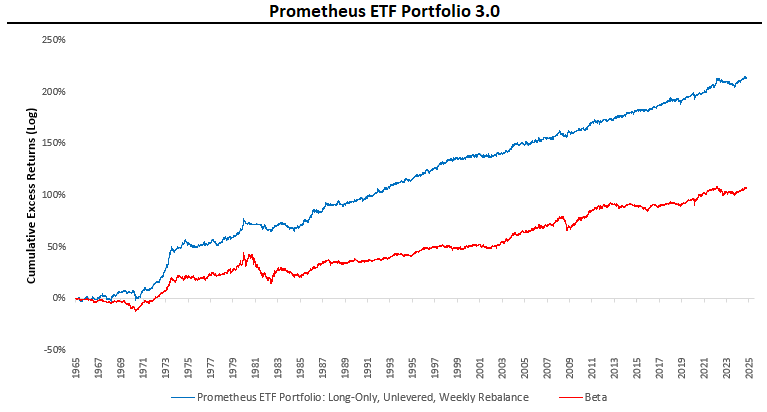
As we can see above, our strategy far outperforms a beta portfolio (equal weight SPY, TLT, DBC, IAU). The strategy shows a full sample Sharpe Ratio of approximately 0.90, compared to the beta portfolio's of 0.45. Our systematic macro process drives this outperformance. We can capture the implicit alpha embedded in this process by going short the beta portfolio and going long ETF Portfolio 3.0:
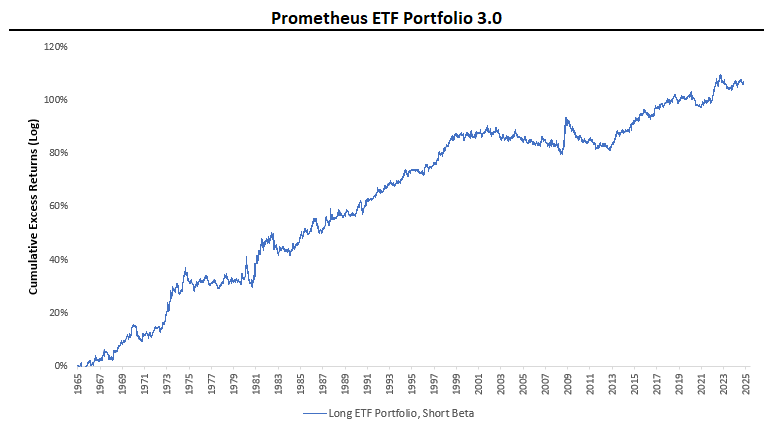
We see there was a period of underperformance on a relative basis from 1997 to 2012, but this was on a relative basis rather than absolute, i.e., the gap between the two strategies compressed. We zoom in on this period below:
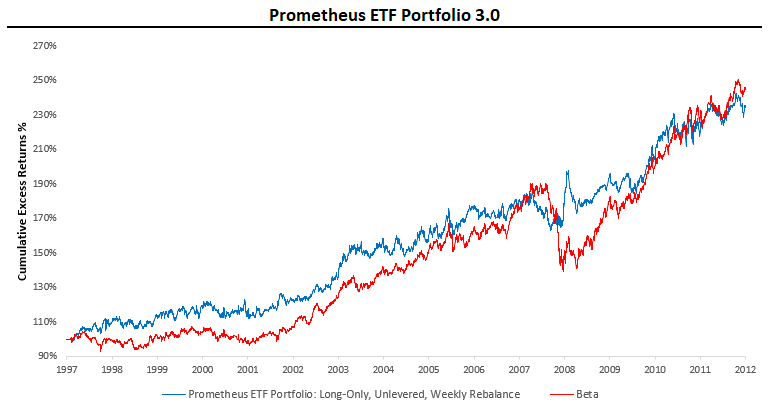
As we can see above, ETF Portfolio maintained its superior return profile in terms of smoothness of returns. Further, ETF Portfolio 3.0 has shown significant consistency across regimes. We visualize this below:
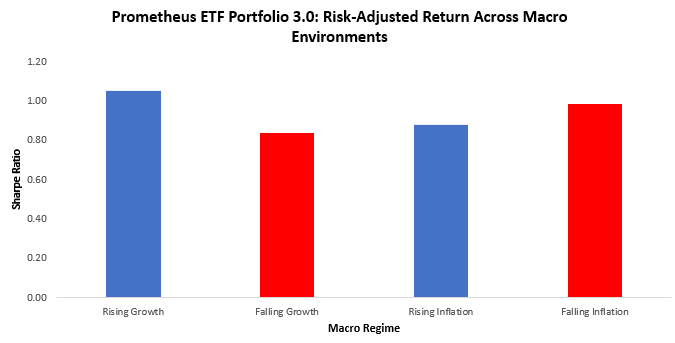
Above, we show the average Sharpe Ratio of Prometheus ETF Portfolio 3.0 across different macro regimes. The lowest reading is in falling growth environments, where our systems delivered a mean Sharpe Ratio of 0.84. We don’t think the variance in these Sharpes is enough to be meaningful for any interpretation beyond randomness and points to a mean Sharpe Ratio across regimes above 0.90.
Finally, we turn to the drawdown profile of Prometheus ETF Portfolio 3.0:
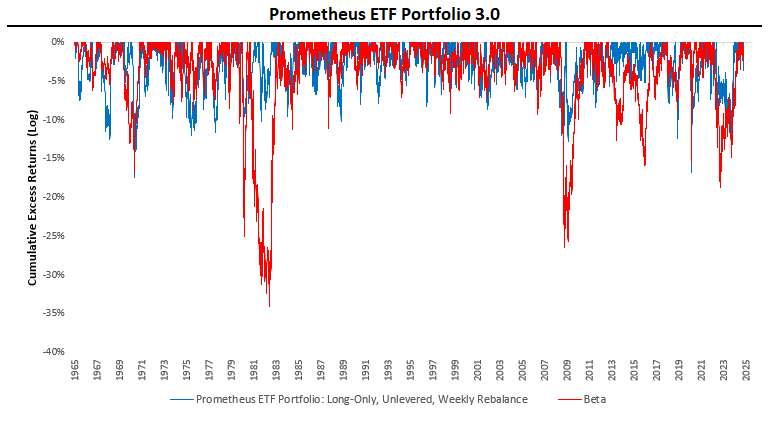
Through a combination of macro timing and appropriate portfolio risk control, which targets a 10% maximum volatility, ETF Portfolio 3.0 has shown extremely strong drawdown control over time. The maximum drawdown recorded was 17% versus the beta portfolio, which showed a maximum drawdown of 34%. We view this drawdown number as modestly overstated, as this drawdown occurred during the 1970s, and poor daily historical data can often put risk control measures offside as the data may not represent the actual moves. From the 80s to now, the maximum drawdown of Prometheus ETF Portfolio 3.0 is 15%, which we consider more reasonable.
We think the upgrades we have integrated into our systematic process will allow investors to continue to achieve strong risk-adjusted returns relative to cash with limited capital drawdowns in depth and duration. In the next section, we share the positions from Prometheus ETF Portfolio 3.0.
Prometheus ETF Portfolio 3.0: Positions
We share the latest positions coming from this upgraded strategy here today.